
Users Guide
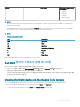

Service Description Attributes Displayed when
using SNMP
• Ship Date
• Start Date
• End Date
• Days Remaining
NOTE:
For more information about monitoring the health of the Compellent controllers, see the specic Dell Compellent Controllers User
’
s
Guide at Dell.com/support.
The Dell EMC Chassis enclosure status will display the Primary Status of the Enclosure only. For more information, see PowerEdge
VRTX Chassis console or the PoweEdge VRTX chassis User’s Guide at Dell.com/support.
NOTE:
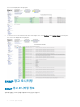
Table 27. Units and description
Unit Description
GHz Giga Hertz
W Watt
GB Giga Byte
RPM Revolutions Per Minute
A Ampere
V Volts
MB Mega Bytes
By default, the preceding services are scheduled once every four hours.
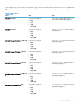
Dell EMC 장치의 구성요소 상태 모니터링
Dell EMC 장치의 구성요소 상태를 모니터링하려면 다음과 같이 하십시오.
1 Nagios Core 사용자 인터페이스의 Current Status(현재 상태) 아래에서 Services(서비스)를 선택합니다.
2 연결된 서비스를 선택하여 Dell EMC 장치의 상태를 모니터링합니다.
Dell EMC 장치의 상태 모니터링은 iDRAC with LC를 통해 수행되며, 해당 세부 정보가 각각의 구성요소 상태 서비스와 함께 올바
른 심각도 상태 색상으로 표시됩니다.
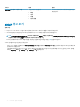
Viewing Dell EMC devices in the Nagios Core console
To view the Dell EMC devices in the Nagios Core console, ensure that the devices are already discovered and inventoried.
You can view the discovered Dell EMC devices in Nagios Core in the Hosts or the Services view:
1 To view the hosts in the Nagios Core, select Hosts under Current Status in the left pane.
Dell EMC 장치 모니터링 31