
Users Guide


Dell EMC デバイスの全体的な正常性を表示するには、次の手順を実行します。
1 Nagios Core ユーザーインタフェースの 現在の状態 下で サービス を選択します。
2 関連づけられたサービスを選択して、全体的な正常性状態を表示します。
サーバーの正常性ポーリングが iDRAC with LC 経由で実行され、対応するオブジェクトがそれぞれの正常性サービスに適切な正常性の重要度色
で表示されます。
Dell EMC デバイスのコンポーネント正常性の監視
サポートされている Dell EMC デバイスの個々のコンポーネントの正常性を監視できます。
About monitoring component health of Dell EMC devices
This is a periodic poll based health monitoring of a Dell EMC device’s component level health status.
Once the discovery utility is run with the relevant option, the corresponding services are created. These services run periodically and
update the overall health of the components. The component’s status and information are displayed in the Nagios Core user interface.
The format of the component information in the Status Information column is <Attribute>=<Value>, <Attribute>=<Value>.
For example: Status=CRITICAL, FQDD=Fan.Embedded.1, State=Enabled
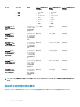
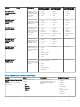
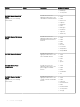
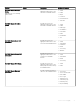
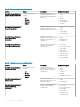
Table 21. Dell EMC device’s component health information
Service Status Description Attributes displayed
when using WSMan
Attributes displayed
when using SNMP
Attributes displayed
when using Redsh
Dell EMC Server
Memory Status
The following states
are possible
:
• OK
• Warning
• Unknown
• Critical
Provides the worst
case aggregate
health status of the
memory in Dell
EMC Servers.
• Status
• FQDD
• Type
• PartNumber
• Size
• State
• Speed
• Status
• FQDD
• Type
• PartNumber
• Size
• State
• Speed
Not Available
Dell EMC Server
Physical Disk
Status
Provides the worst
case aggregate
health status of the
physical disks in Dell
EMC Servers.
• Status
• ProductID
• SerialNumber
• Size
• Media Type
• Revision
• State
• Status
• FQDD
• ProductID
• SerialNumber
• Size
• Media Type
• Revision
• State
Not Available
Dell EMC Server
Virtual Disk Status
Provides the worst
case aggregate
health status of the
virtual disks in Dell
EMC Servers.
• Status
• FQDD
• Layout
• Size
• MediaType
• Status
• FQDD
• Layout
• Size
• MediaType
Not Available
Dell EMC デバイスの監視
25