
Users Guide


For more information about monitoring the health of the Compellent controllers, see the specific
Dell Compellent
Controllers User’s Guide
at Dell.com/support.
The Dell EMC Chassis enclosure status will display the Primary Status of the Enclosure only. For more information, see
PowerEdge VRTX Chassis console or the PoweEdge VRTX chassis User’s Guide at Dell.com/support.
NOTE:
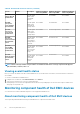
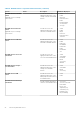
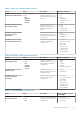
Table 27. Units and description
Unit Description
GHz Giga Hertz
W Watt
GB Giga Byte
RPM Revolutions Per Minute
A Ampere
V Volts
MB Mega Bytes
By default, the preceding services are scheduled once every four hours.
Monitoring component health status of Dell EMC devices
To monitor the component health status of Dell EMC devices:
1. In Nagios Core user interface, under Current Status, select Services.
2. Select the associated service to monitor the health of Dell EMC device.
Health monitoring of Dell EMC devices is performed through iDRAC with LC and corresponding details are shown in their respective
component health service with proper severity health color.
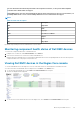
Viewing Dell EMC devices in the Nagios Core console
To view the Dell EMC devices in the Nagios Core console, ensure that the devices are already discovered and inventoried.
You can view the discovered Dell EMC devices in Nagios Core in the Hosts or the Services view:
1. To view the hosts in the Nagios Core, select Hosts under Current Status in the left pane.
The hosts are displayed in the right pane.
2. To view the services associated with the hosts in the Nagios Core, select Services under Current Status in the left pane.
Monitoring Dell EMC devices
29