
Users Guide
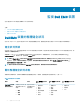

About monitoring component health of Dell EMC devices
This is a periodic poll based health monitoring of a Dell EMC device’s component level health status.
Once the discovery utility is run with the relevant option, the corresponding services are created. These services run periodically and
update the overall health of the components. The component’s status and information are displayed in the Nagios Core user interface.
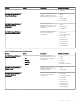
The format of the component information in the Status Information column is <Attribute>=<Value>, <Attribute>=<Value>.
For example: Status=CRITICAL, FQDD=Fan.Embedded.1, State=Enabled
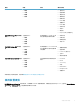
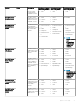
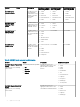
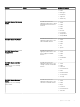
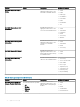
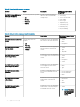
Table 21. Dell EMC device’s component health information
Service Status Description Attributes displayed
when using WSMan
Attributes displayed
when using SNMP
Attributes displayed
when using Redsh
Dell EMC Server
Memory Status
The following states
are possible:
• OK
• Warning
• Unknown
• Critical
Provides the worst
case aggregate
health status of the
memory in Dell
EMC Servers.
• Status
• FQDD
• Type
• PartNumber
• Size
• State
• Speed
• Status
• FQDD
• Type
• PartNumber
• Size
• State
• Speed
Not Available
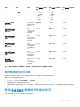
Dell EMC Server
Physical Disk
Status
Provides the worst
case aggregate
health status of the
physical disks in Dell
EMC Servers.
• Status
• ProductID
• SerialNumber
• Size
• Media Type
• Revision
• State
• Status
• FQDD
• ProductID
• SerialNumber
• Size
• Media Type
• Revision
• State
Not Available
Dell EMC Server
Virtual Disk Status
Provides the worst
case aggregate
health status of the
virtual disks in Dell
EMC Servers.
• Status
• FQDD
• Layout
• Size
• MediaType
• ReadCachePolicy
• WriteCachePolic
y
• StripeSize
• State
• Status
• FQDD
• Layout
• Size
• MediaType
• ReadCachePolicy
• WriteCachePolicy
• StripeSize
• State
Not Available
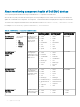
Dell EMC Server
Fan Status
Provides overall
health status of the
fans in Dell EMC
• Status
• FQDD
• Status
• FQDD
• Status
• FQDD
24
監視 Dell EMC 裝置