
Users Guide
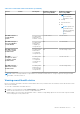
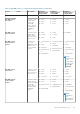
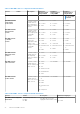
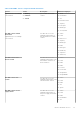
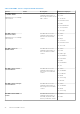
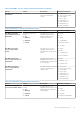
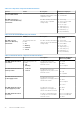
Table Of Contents
- Dell EMC OpenManage Plug-in Version 2.1 for Nagios Core User’s Guide
- Contents
- Introduction to Dell EMC OpenManage Plug-in Version 2.1 for Nagios Core
- What is new in Dell EMC OpenManage Plug-in version 2.1
- Key features
- Support matrix
- Device discovery and inventory
- Monitor Dell EMC devices
- Launching Dell EMC device specific consoles
- Warranty information for Dell EMC devices
- Removing Dell EMC devices
- Knowledge Base (KB) messages for the generated alerts
- Troubleshooting
- Frequently asked questions
- Appendix

Monitor component health of Dell EMC devices
You can monitor the health of individual components of the supported Dell EMC devices.
About monitoring component health of Dell EMC devices
This is a periodic poll based health monitoring of a Dell EMC device’s component level health status.
Once the discovery utility is run with the relevant option, the corresponding services are created. These services run periodically
and update the overall health of the components. The component’s status and information are displayed in the Nagios Core user
interface.
The format of the component information in the Status Information column is <Attribute>=<Value>,
<Attribute>=<Value>.
For example: Status=CRITICAL, FQDD=Fan.Embedded.1, State=Enabled
Table 21. Dell EMC device’s component health information (continued)
Service Status Description Attributes
displayed when
using WSMan
Attributes
displayed when
using SNMP
Attributes
displayed when
using Redfish
Dell EMC Server
Memory Status
The following
states are
possible:
● OK
● Warning
● Unknown
● Critical
Provides the
worst case
aggregate health
status of the
memory in Dell
EMC Servers.
● Status
● FQDD
● Type
● PartNumber
● Size
● State
● Speed
● Status
● FQDD
● Type
● PartNumber
● Size
● State
● Speed
Not Available
Dell EMC Server
Physical Disk
Status
Provides the
worst case
aggregate health
status of the
physical disks in
Dell EMC Servers.
● Status
● ProductID
● SerialNumber
● Size
● Media Type
● Revision
● State
● Status
● FQDD
● ProductID
● SerialNumber
● Size
● Media Type
● Revision
● State
Not Available
Dell EMC Server
Virtual Disk
Status
Provides the
worst case
aggregate health
status of the
virtual disks in Dell
EMC Servers.
● Status
● FQDD
● Layout
● Size
● MediaType
● ReadCachePolic
y
●
WriteCachePoli
cy
● StripeSize
● Status
● FQDD
● Layout
● Size
● MediaType
● ReadCachePolicy
● WriteCachePolicy
● StripeSize
● State
Not Available
24 Monitor Dell EMC devices