Dell EMC OpenManage Plug-in Version 2.1 for Nagios Core User’s Guide April 2021 Rev.
Notes, cautions, and warnings NOTE: A NOTE indicates important information that helps you make better use of your product. CAUTION: A CAUTION indicates either potential damage to hardware or loss of data and tells you how to avoid the problem. WARNING: A WARNING indicates a potential for property damage, personal injury, or death. © 2017-2021 Dell Inc. or its subsidiaries. All rights reserved. Dell, EMC, and other trademarks are trademarks of Dell Inc. or its subsidiaries.
Contents Chapter 1: Introduction to Dell EMC OpenManage Plug-in Version 2.1 for Nagios Core.................. 5 Chapter 2: What is new in Dell EMC OpenManage Plug-in version 2.1............................................ 6 Chapter 3: Key features.................................................................................................................7 Chapter 4: Support matrix.............................................................................................................
Appendix A: Appendix..................................................................................................................
1 Introduction to Dell EMC OpenManage Plugin Version 2.1 for Nagios Core This guide provides information about using the Dell EMC OpenManage Plug-in Version 2.1 for Nagios Core and its various features such as discovering, monitoring, launching consoles, and troubleshooting of the supported Dell EMC devices. The guide also provides details of the supported Dell EMC devices and frequently asked questions by the customer.
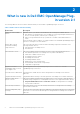
2 What is new in Dell EMC OpenManage Plugin version 2.1 The following table lists the new features and functionality of the Dell EMC OpenManage Plug-in version 2.1: Table 1.
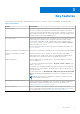
3 Key features The key features of the Dell EMC OpenManage Plug-in Version 2.1 for Nagios Core are as described in the following table. Table 2. Key features Feature Functionality Device discovery Discovers the supported Dell EMC devices in the Nagios Core console. Once the discovery is complete, host and service definitions are created for each device. To discover Dell Servers through iDRAC with Lifecycle Controller, you can opt for either SNMP or WSMan protocol.
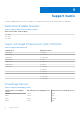
4 Support matrix Dell EMC OpenManage Plug-in version 2.1 for Nagios Core supports the Dell EMC devices as listed in the following tables. Datacenter Scalable Solutions Table 3. Supported Datacenter Scalable Solutions. Datacenter Scalable Solutions (DSS) DSS 1500 DSS 1510 DSS 2500 Hyper-converged Infrastructure (HCI) Platforms Table 4.
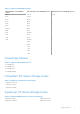
Table 5. Supported PowerEdge Servers. 12th generation of PowerEdge servers 13th generation of PowerEdge servers 14th generation of PowerEdge servers M820 FC630 C6420 R220 FC830 R320 M630 R420 M830 R520 R230 R620 R330 R720xd R430 R820 R530 R920 R530xd T320 R630 T420 R730 T620 R730xd R830 R930 T130 T330 T430 T630 PowerEdge Chassis Table 6. Supported PowerEdge chassis. PowerEdge FX2 PowerEdge FX2s PowerEdge VRTX PowerEdge M1000e Compellent SC-Series Storage Arrays Table 7.
Table 8. Supported EqualLogic PS-Series Storage Arrays. EqualLogic PS6500 EqualLogic PS6510 PowerVault MD-Series Storage Arrays Table 9. Supported PowerVault MD-Series Storage Arrays.
5 Device discovery and inventory Topics: • • • • • • About device discovery About Dell EMC device discovery utility About protocol parameters Discovering Dell EMC devices Device information Viewing Dell EMC devices in the Nagios Core console About device discovery You can discover the supported Dell EMC devices with this plug-in in the Nagios Core console.
About Dell EMC device discovery utility To run the Dell Device Discovery Utility, navigate to /dell/scripts, and run the following Python command: python dellemc_nagios_discovery_service_utility.py -h All the available Dell EMC device discovery utility options are displayed. Table 10. Dell EMC Device Helper Utility options Options Description -h Displays the help message. --host Host IP address or HostName to be discovered.
Table 10. Dell EMC Device Helper Utility options Options Description --force --force rewrites the config file. --warranty.criticalDays Warranty critical days. Allowed value is [1-365]. Default value is 10. NOTE: The value of Warranty critical days should be less than Warranty warning days. --warranty.warningDays Warranty warning days. Allowed value is [1-365]. Default value is 30. --nagios.type Decides the output format of the host file. Allowed options is 0 for .cfg format and 1 for .xml format.
Table 12.
Table 14.
Table 16. Default services created for EqualLogic PS-Series Storage Arrays based on SNMP protocol Services Basic Services Detailed Services Dell EMC Storage PS-Series Member Physical Disk Status Dell EMC Storage PS-Series Group Volume Status Dell EMC Storage PS-Series Group Storage Pool Status Dell EMC Storage PS-Series Group Storage Pool Information Dell EMC Storage PS-Series Member Warranty Information Table 17.
Table 18. Parameters file Protocol communication parameters Description wsman.timeout Use to input WSMan timeout value in seconds. Default timeout value is 60 seconds. wsman.retries Use to input the number of times a WSMan request must be sent when a timeout occurs. Default retry value is 2. NOTE: You can configure the user macros, snmp.community, wsman.username, and wsman.password in the file dell_resources.
7. You can view the logged information in the Log file path: /var/dell/ discovery_.dbg In the filename, pertains to the time when the log information was gathered; yyyy is the calendar year, mm is month, dd is date, hh is hour of the day, mi is minutes, and ss is seconds. After completion of discovery: ● Dell EMC device Host definition and its service definitions are created in the Nagios server and this is subsequently used for monitoring the Dell EMC devices.
Table 19. Device Information (continued) Service Status Description Attributes Displayed ● OK ● Unknown information for PowerEdge M1000e, PowerEdge VRTX, and PowerEdge FX2/FX2s chassis.
Table 19.
Device discovery and inventory 21
6 Monitor Dell EMC devices You can monitor the aspects of Dell EMC devices as explained in the following sections. Topics: • • • Overall health status of the Dell EMC devices Monitor component health of Dell EMC devices Monitoring SNMP alerts Overall health status of the Dell EMC devices You can monitor the overall health status of the Dell EMC devices in the Nagios Core console. The overall health status is an aggregate status of the components of the supported Dell EMC devices.
Table 20. Overall health Status information (continued) Service Status Description Attributes displayed when using WSMan Attributes displayed when using SNMP NOTE: Signifies the overall Fan redundancy status. ● Storage ● Chassis Intrusion ● Fan NOTE: Signifies the overall Fan status without considering the redundancy status. Dell EMC Chassis Overall Health Status Overall Chassis Provides global health status of Dell EMC Chassis.
Monitor component health of Dell EMC devices You can monitor the health of individual components of the supported Dell EMC devices. About monitoring component health of Dell EMC devices This is a periodic poll based health monitoring of a Dell EMC device’s component level health status. Once the discovery utility is run with the relevant option, the corresponding services are created. These services run periodically and update the overall health of the components.
Table 21. Dell EMC device’s component health information (continued) Service Status Description Attributes displayed when using WSMan Attributes displayed when using SNMP Attributes displayed when using Redfish ● State Dell EMC Server Fan Status Dell EMC Server Intrusion Status Dell EMC Server Network Device Status Provides overall health status of the fans in Dell EMC Server without considering the redundancy status.
Table 21. Dell EMC device’s component health information Service Status Description Attributes displayed when using WSMan Attributes displayed when using SNMP Attributes displayed when using Redfish will display Not Available. Dell EMC Server Temperature Probe Status Dell EMC Server Voltage Probe Status Dell EMC Server Controller Status Provides overall health status of the temperature probe in Dell EMC Servers.
Table 22. Dell EMC Chassis component health information Service Status Description Attributes Displayed Applicable only to PowerEdge VRTX chassis. ● Warning physical disks in Dell EMC Chassis. ● Model ● Unknown ● PartNumber ● Slot ● Critical ● FirmwareVersion ● Capacity ● FreeSpace ● MediaType ● SecurityState Dell EMC Chassis Virtual Disk Status Applicable only to PowerEdge VRTX chassis. Provides the worst case aggregate health status of the virtual disks in Dell EMC Chassis.
Table 22. Dell EMC Chassis component health information Service Status Dell EMC Chassis Controller Status Applicable only to PowerEdge VRTX chassis. Description Attributes Displayed Provides the worst case aggregate health status of the storage controllers in Dell EMC Chassis. ● Status ● FQDD ● CacheSize ● FirmwareVersion ● Name ● PatrolReadState ● SecurityStatus ● SlotType Dell EMC Chassis Enclosure Status Applicable only to PowerEdge VRTX chassis.
Table 22. Dell EMC Chassis component health information (continued) Service Status Dell EMC Chassis Warranty Information Description Attributes Displayed Provides warranty information ● ServiceTag ● Service Level Details status for the Dell EMC Chassis. ● Item number ● Device Type ● Ship Date(UTC) ● Start Date(UTC) ● End Date(UTC) ● Days Remaining Table 23.
Table 24. Compellent component health information Service Status Description Attributes Displayed Dell EMC Storage SCSeries Volume Status ● Status Provides the worst case aggregate health status of the ● VolumeName Compellent volume. Dell EMC Storage SCSeries Controller Warranty Information Provides warranty information ● ServiceTag ● Service Level Details status for the Compellent storage arrays.
Table 26. Network Switch component health information Service Description Attributes Displayed when using SNMP Dell EMC Network Switch vFlash Status Provides the worst case aggregate health status of the Network Switch. ● MountPoint ● Size ● Name Dell EMC Network Switch Physical Port Status Provides the worst case aggregate health status of the physical ports in Dell EMC Network Switch. ● Status NOTE: The Status attribute displays the health status of the Admin Status.
1. In Nagios Core user interface, under Current Status, select Services. 2. Select the associated service to monitor the health of Dell EMC device. Health monitoring of Dell EMC devices is performed through iDRAC with LC and corresponding details are shown in their respective component health service with proper severity health color. Monitoring SNMP alerts About SNMP alert monitoring You can asynchronously receive the SNMP alerts forwarded from the devices.
Table 28. Dell trap information Service Status Description ● Critical Dell EMC Storage MD-Series Traps The following states are possible: ● OK ● Warning Provides trap Information of the PowerVault MD-Series storage arrays. ● Unknown ● Critical Viewing SNMP alerts Prerequisites: ● Nagios Core with SNMPTT is installed and configured and the Dell integration on SNMPTT is configured. ● SNMP Trap destination is configured with Nagios Core server in the supported Dell EMC devices.
7 Launching Dell EMC device specific consoles To launch console for a supported Dell EMC device: 1. In Nagios Core console, under Current Status, select any of the following: ● Hosts ● Services ● Host Groups > 2. Click (Perform Extra Host Actions icon) adjacent to the Dell EMC device. The respective Dell EMC console is launched in a new window.
8 Warranty information for Dell EMC devices With this feature, you can access the warranty information for the discovered Dell EMC devices. This feature allows you to monitor the Dell EMC device’s warranty details in the Nagios Core console. An active Internet connection is required to retrieve the warranty information. If you do not have direct internet access and are using proxy settings to access the internet, ensure that you resolve the host name api.dell.com in the etc/hosts file.
● In case there is any change in a discovered device’s IP address, rediscover the device again to receive correct warranty information for that device. NOTE: The warranty status will be determined based on the Configured warranty, critical thresholds and maximum value of the days remaining. The value of the warranty status will be shown as Critical, when the device warranty has expired.
9 Removing Dell EMC devices You can remove a Dell EMC device that you do not want to monitor. 1. Navigate to /dell/config/objects, and delete the corresponding .cfg file. 2. For completing the removal of the Dell EMC device, restart the Nagios Core services by running the following command: service nagios restart.
10 Knowledge Base (KB) messages for the generated alerts You can get more information about the SNMP alerts generated by the discovered Dell EMC devices from the KB messages for that device in the Nagios Core console. Viewing KB messages To 1. 2. 3. view the KB messages for an SNMP alert generated by a discovered Dell EMC device complete the following steps: Log in to the Nagios Core console. In the left pane, click on Services under Current Status.
11 Troubleshooting This section lists the problems that you may encounter while using the Dell EMC OpenManage Plug-in for Nagios Core and their workarounds. Ensure that you meet the requirements, or perform the steps listed in this section. SNMP traps are not received from the Dell EMC devices in the Nagios Core Console for Ubuntu setup. Resolution :Replace #!/bin/sh to #!/bin/bash in /libexec/eventhandlers/submit_check_result and then, restart SNMPTT and Nagios service.
The discovery script is failing to execute 1. The discovery script has appropriate permissions. Recommended: Nagios Administrator. 2. The appropriate arguments are provided while running the script. The discovery script is not creating the host and service definition file for IPv4 or IPv6 addresses or hosts when the protocol selected is 1 (SNMP) 1. 2. 3. 4. Net-SNMP is installed. The IP addresses or hosts are reachable. SNMP is enabled on the given IP addresses or hosts.
The Dell EMC device’s IP address or host name changes after discovery of the device Remove the old configuration file and rediscover the Dell EMC device using a new IP address or hostname. The Nagios Core Console is not displaying the Dell EMC devices that are discovered using the Dell EMC discovery script 1. The host and service definition files exist in the /dell/config/objects folder. 2. The Nagios service has been restarted after running a discovery. 3.
Dell EMC OpenManage Plug-in specific services are displaying the message, “WSMan Error while communicating with host” 1. Openwsman and its Perl binding and Net-IP are installed. 2. The IP addresses or hosts provided are reachable. 3. The appropriate WSMan parameters are correctly configured in the following files: dell_resource.cfg .dell_device_comm_params.
For more information on downloading and installing RACADM, go to “en.community.dell.com/techcenter/systemsmanagement/w/wiki/3205.racadm-command-line-interface-for-drac” Unable to monitor the Warranty information for the discovered Dell EMC devices in the Nagios Core Console ● Ensure that you have an active internet connection. If you do not have direct internet access and are using proxy settings to access the internet, ensure that you resolve the host name api.dell.com in the etc/hosts file.
12 Frequently asked questions 1. Question: Can you provide information on Licensing of Dell EMC OpenManage Plug-in for Nagios Core? Answer: You can install and use this plug-in for free. 2. Question: What are the Dell EMC hardware models supported by the plug-in? Answer: For the list of supported Dell EMC platforms, see Support Matrix. 3. Question: I have earlier generation of servers (9th Generation – 11th Generation) in my data center.
A Appendix Configuring SNMP parameters for iDRAC using the iDRAC web console 1. Launch the iDRAC (12th and later generation of PowerEdge servers) web console and navigate to Network > Services in the console. 2. Configure the SNMP Agent properties: a. Set Enabled to True and SNMP Protocol to All (SNMP v1/v2/v3). b. Set SNMP Community Name with a community string. c. Click Apply to submit the configuration. NOTE: The Plug-in communicates with iDRAC using only SNMP v1 or SNMP v2 protocol.
● In the Alerts section, enable Alerts . ● In the Alerts Filter section, select the required fields under Category and Severity. You will not receive any SNMP alerts if none of these fields are selected. ● In the Alerts and Remote System Log Configuration section, select the required fields thereby configuring the SNMP alerts. 4.