
Users Guide
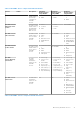
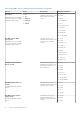
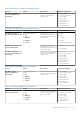

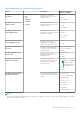
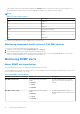
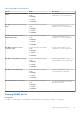
Table Of Contents
- Dell OpenManage Plug-in Version 2.0 for Nagios Core User’s Guide
- Contents
- Introduction to Dell EMC OpenManage Plug-in Version 3.1 for Nagios Core
- What is new
- Key features
- Support matrix
- Device discovery and inventory
- Monitoring Dell EMC devices
- Launching Dell EMC device specific consoles
- Warranty information for Dell EMC devices
- Removing Dell EMC devices
- Knowledge Base messages for the generated alerts
- Troubleshooting
- Frequently asked questions
- Appendix

The Dell EMC Chassis enclosure status will display the Primary Status of the Enclosure only. For more information, see
PowerEdge VRTX Chassis console or the PoweEdge VRTX chassis User’s Guide at Dell.com/support.
NOTE:
Table 33. Units and description
Unit Description
GHz Giga Hertz
W Watt
GB Giga Byte
RPM Revolutions Per Minute
A Ampere
V Volts
MB Mega Bytes
By default, the preceding services are scheduled once every four hours.
Monitoring component health status of Dell EMC devices
To monitor the component health status of Dell EMC devices:
1. In Nagios Core user interface, under Current Status, select Services.
2. Select the associated service to monitor the health of Dell EMC device.
Health monitoring of Dell EMC devices is performed through iDRAC with LC and corresponding details are shown in their
respective component health service with proper severity health color.
Monitoring SNMP alerts
About SNMP alert monitoring
You can asynchronously receive the SNMP alerts forwarded from the devices.
Once an SNMP alert is received, the respective device’s service will display the alert summary message and alert severity of the
last received alert in the Nagios Core console.
Table 34. Dell EMC trap information
Service Status Description
Dell EMC Server Traps The following states are possible:
● OK
● Warning
● Critical
● Unknown
Provides trap Information of the Dell
EMC Server raised through agent-free
method.
Dell EMC Chassis Traps The following states are possible:
● OK
● Warning
● Critical
● Unknown
Provides trap Information of the
MX7000, M1000e, VRTX, and FX2/FX2s
Chassis.
38 Monitoring Dell EMC devices