
Users Guide
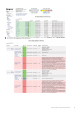
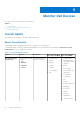
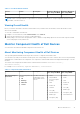
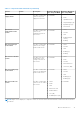
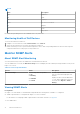
Table Of Contents
- Dell OpenManage Plug-in Version 1.0 for Nagios Core User’s Guide
- Contents
- Introduction to Dell OpenManage Plug-in Version 1.0 for Nagios Core
- Support matrix
- Device Discovery and Inventory
- Monitor Dell Devices
- Launching iDRAC Web Console
- Removing Dell Devices
- Troubleshooting
- Frequently Asked Questions
- Appendix

NOTE:
Unit Description
GHz Giga Hertz
W Watt
GB Giga Byte
RPM Revolutions Per Minute
A Ampere
V Volts
MB Mega Bytes
By default, the preceding services are scheduled once every four hours.
Monitoring Health of Dell Devices
To monitor the health of Dell devices:
1. In Nagios Core user interface, under Current Status, select Services.
2. Select the associated service to monitor the health of Dell devices.
Health monitoring of servers is performed through iDRAC with LC and corresponding details are shown in their respective
component health service with proper severity health color.
Monitor SNMP Alerts
About SNMP Alert Monitoring
You can asynchronously receive the SNMP alerts forwarded from the devices.
Once an SNMP alert is received, the Dell Server Traps service will display the alert summary message and alert severity in the
Nagios Core console.
Table 8. Server Trap Information
Service Status Description
Dell Server Traps The following states are possible:
● OK
● Warning
● Unknown
● Critical
Provides trap Information of the
Dell server raised through agent-free
method.
Displays the last received SNMP alert.
To view all the SNMP alerts that were
received, select Reports > Alerts >
History.
Viewing SNMP Alerts
Prerequisites:
● Nagios Core with SNMPTT is installed and configured and the Dell integration on SNMPTT is configured.
● SNMP Trap destination is configured with Nagios Core server in iDRAC.
For information on configuring SNMP Trap destination in the iDRAC interface, see Appendix.
To view SNMP alerts:
16
Monitor Dell Devices