
Users Guide

• Tap Chassis.
• Tap View All.
Tap the appropriate chassis group.
The Chassis Group Dashboard is displayed. You can view the health status of the chassis in the group.
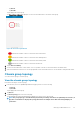
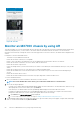
Figure 48. Chassis Group dashboard
• —Indicates the number of devices or alerts that are in Critical status
• —Indicates the number of devices or alerts that are in Warning status
• —Indicates the number of devices or alerts that are in Healthy status
• —Indicates the number of devices or alerts that are unknown
2. Tap the Chassis summary.
3. You can view the health status of each chassis. The color symbols on the left of each chassis denote the health status.
4. Select the lead chassis from the list to view the group details. Select the member chassis to view the details of that particular chassis.
Chassis group topology
You can view the topology of a chassis group.
View the chassis group topology
Perform the following to view the topology:
1. In the Inventory section of OpenManage Mobile home page, perform one of the following:
• Tap Chassis.
• Tap View All.
Tap the appropriate chassis group.
2. Tap Chassis.
3. Tap Show Topology in the lower end of the page.
The OpenManage Entreprise-Modular application displays the topology of the chassis group.
NOTE:
The group topology is a troubleshooting aid, and the port wiring connections are dynamically traced. Hence, it
may take several minutes to display the topology when there are multiple chassis with each having multiple port
connections.
Managing an MX7000 chassis 57