
Users Guide


• Home portal, see OpenManage Essentials Home Portal Reference.
• Device portal, see Devices Reference.
• Discovery and inventory portal, see Discovery And Inventory Reference.
• Reports portal, see Reports Reference.
.
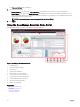
Displaying additional reports and graphs
Charts have drill-down feature. To view additional reports and graphs, click the
Figure 2. Adding additional reports and graphs icon
icon on the top right corner. The following list of available reports and graphs is displayed:
• Alerts by Severity
• Devices by Status
• Discovered vs. Inventoried Devices
• Alerts
• Asset Acquisition Information
• Asset Maintenance Information
• Asset Support Information
• ESX Information
• FRU Information
• Hard Drive Information
• HyperV Information
• License Information
• Memory Information
• Modular Enclosure Information
• NIC Information
• PCI Device Information
• Server Components and Versions
• Server Overview
• Storage Controller Information
• Task Status
After selecting the desired report or graph, dock the report or graph by using the following control to the desired location:
Figure 3. Docking icon
Drilling down charts and reports for more information
To drill-down for further details, perform one of the following:
• In report charts, click the charts.
40