
Users Guide
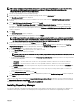

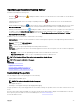

OpenManage Essentials Heading Banner
The banner may display the following icons:
• Critical icon and Warning icon including the number of devices. You can click the icon or the number to view the devices
in either state.
• OpenManage Essentials service not running icon (blinking down arrow) . You can click the icon to view the details and to
restart the service.
• Update available notication icon indicates if a newer version of OpenManage Essentials is available. Click the icon to open a
New Version Available window that displays the currently installed and newly available version of OpenManage Essentials.
• Warranty scoreboard notication icon including the number of devices with x days or less of warranty. You can click the icon
or number to view the Device Warranty Report that lists the device with certain days or less of warranty. The warranty
scoreboard notication icon is displayed only if you have selected Enable Warranty Scoreboard Notications in Settings →
Warranty Notication Settings.
In addition to the icons, the banner also contains links to the following:
• Dell TechCenter — Click to view the information on various technologies, best practices, knowledge sharing, and information on
Dell products.
• Support — Click to open dell.com/support.
• Help — Click to open the online help.
• About — Click to view general OpenManage Essentials product information.
•
User name
— Displays the user name of the currently logged in user. Move the mouse pointer over the user name to display the
following options:
– User Info — Click to view the OpenManage Essentials roles associated with the current user.
– Sign in as Dierent User — Click to log in to OpenManage Essentials as a dierent user.
NOTE: The Sign in as Dierent User option is not supported on Google Chrome.
NOTE: The banner is available in all the pages.
Related links
Viewing the user information
Logging in as a dierent user
Using the Update Available Notication Icon
Using the Warranty Scoreboard Notication Icon
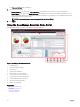
Customizing the portals
You can change the layout of the portal page to do the following:
• Display additional available reports.
NOTE: This option is only available in the Home portal.
• Hide graphs and reports.
• Rearrange or resize graphs and reports by dragging and dropping.
If a pop-up window on any screen is bigger than the screen and if scrolling is not possible, set the zoom value of the browser to 75%
or less.
From the various reports that are available, you can select specic reports and set them to display on the Dashboard. You can click
these reports to get more details. For the list of available reports, see Home Portal Reports.
For more information on the:
39