
Users Guide
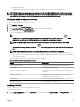
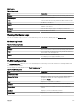

Alert Details
Table 44. Alert Details
Field Description
Severity Alert severity based on Normal, Critical, Warning, and Unknown.
Acknowledged Flagged status for an alert.
Time Time at which the alert was generated in date and time format.
Device IP address of the device.
Details Lists the alert information. For example, System is down:<IP
Address of the device>
Category Lists the alert category type, for example System Events.
Source Lists the alert source name.
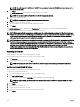
Viewing Hardware Logs
You can view hardware logs for servers. To view hardware logs, from the inventory details page, click Hardware Logs.
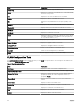
Hardware Log Details
Table 45. Hardware Log Details
Field Description
Severity Alert severity based on Normal, Critical, Warning, and Unknown.
Time The system time at which this alert was generated in date and
time format on the managed node.
Details Lists the details of the hardware log.
For example, power supply redundancy is lost.
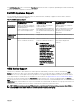
VLAN Conguration
The VLAN Conguration tab allows you to view and manage the VLAN settings of the IOAs within the PowerEdge M1000e and
PowerEdge FX2/FX2s chassis.
The following are the elds displayed in the VLAN Conguration tab:
Table 46. VLAN Conguration
Field Description
Last Inventory Time
Displays the last VLAN inventory time.
Grouped by: Fabric
Displays the attribute by which the currently displayed data is
grouped. By default, the VLAN conguration inventory is
grouped by Fabric.
Total
Displays the total number of attributes.
Modied
Displays the number of attributes that you have modied.
Chassis Blade
Displays details of the blade servers that are installed in the
chassis.
Modied
Displays if you have modied the VLAN ID.
Server Name
Displays the host name of the blade server.
109