
Users Guide


OpenManage Enterprise Graphical User
Interface overview
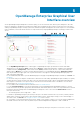
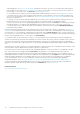
On the OpenManage Enterprise Graphical User Interface (GUI), you can use menu items, links, buttons, panes, dialog boxes, lists, tabs,
filter boxes, and pages to navigate between pages and complete device management tasks. Features such as devices list, Donut charts,
audit logs, OpenManage Enterprise settings, system alerts, and firmware update are displayed at more than one place. It is recommended
that you familiarize yourself with the GUI elements for easily and effectively using OpenManage Enterprise to manage your data center
devices.
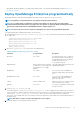
• A—The OpenManage Enterprise menu, on all the pages of OpenManage Enterprise, provides links to features that enable
administrators view the dashboard (Home), manage devices (Devices), manage firmware baselines, templates, and configuration
compliance baselines (Configuration), create and store alerts (Alerts), and then run jobs, discover, collect inventory data, and
generate reports (Monitor). You can also customize different properties of your OpenManage Enterprise (Application Settings).
Click the pin symbol in the upper-right corner to pin the menu items so they appear on all the OpenManage Enterprise pages. To
unpin, click the pin symbol again.
• B—The Dashboard symbol. Click to open the dashboard page from any page of OpenManage Enterprise. Alternately, click Home. See
Dashboard.
• C—The Donut chart gives a snapshot of health status of all the devices monitored by OpenManage Enterprise. Enables you to quickly
act upon the devices that are in critical state. Each color in the chart represents a group of devices having a particular health state.
Click respective color bands to view respective devices in the devices list. Click the device name or IP address to view the device
properties page. See Viewing and configuring devices.
• D—The symbols used to indicate the device health state. See Device health statuses.
• E—In the Search Everything box, enter about anything that is monitored and displayed by OpenManage Enterprise to view the
results such as device IP, job name, group name, firmware baseline, and warranty data. You cannot sort or export data that is retrieved
by using the Search Everything feature. On individual pages or dialog boxes, enter or select from the Advance Filters section to
refine your search results.
• The following operators are not supported: +, -, and ".
• F—Number of OpenManage Enterprise jobs currently in the queue. Jobs that are related to discovery, inventory, warranty, firmware
update, and so on. Click to view the status of jobs run under Health, Inventory, and the Report category on the Job Details page. To
view all the events, click All Jobs. See Using jobs for device control. Click to refresh.
• G—The number of events generated in the alerts log. Also, based on your settings to whether or not view the unacknowledged alerts,
the number of alerts in this section varies. By default, only the unacknowledged alerts are displayed. To hide or unhide the
5
OpenManage Enterprise Graphical User Interface overview 29