
Users Guide


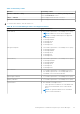


Table 9. Granularity of data
Duration Granularity of data
6 Hours or 12 Hours or 1 Day Data is displayed based on the Metric gathering interval
set in the Preferences section.
7 Days or 1 Month Data is displayed at an interval of one hour.
3 Months or 6 Months or 1 Year Data is displayed at an interval of one day.
4. To view the latest metrics, click the refresh icon.
Table 10. List of Power Manager metrics and supported devices
Metric Supported devices
Power History
● 12
th
and later generations of PowerEdge servers (Intel)
NOTE: Cabled PSU servers are not supported.
NOTE: PowerEdge Fm120 aqua is not supported.
● PowerEdge MX7000
● PowerEdge M1000e
● PowerEdge VRTX
● PowerEdge FX2
● PowerEdge FX2s
Energy Consumption
● 12
th
and later generations of PowerEdge servers (Intel)
● PowerEdge MX7000
● PowerEdge M1000e
● PowerEdge VRTX
● PowerEdge FX2
● PowerEdge FX2s
Thermal History
● 12
th
and later generations of PowerEdge servers (Intel)
● PowerEdge MX7000
● PowerEdge M1000e
● PowerEdge VRTX
● PowerEdge FX2
● PowerEdge FX2s
CPU Utilization
● 13
th
and later generations of PowerEdge Intel servers
● 15
th
and later generations of Poweredge AMD servers
with iDRAC version 4.30.30.30 and later
Input Output Utilization
● 13
th
and later generations of PowerEdge servers (Intel)
Memory Utilization
● 13
th
and later generations of PowerEdge servers (Intel)
System Airflow
● Non-modular PowerEdge servers
○ Latest generation of AMD servers with iDRAC Data
Center license and iDRAC version 4.10.10.10 and
above
NOTE: 14
th
generation AMD servers with iDRAC
version 4.10.10.10 and above.
Viewing Metrics and Monitoring History in Power Manager 27