
Users Guide
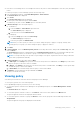
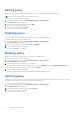
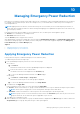

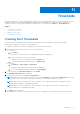

Table Of Contents
- Dell EMC OpenManage Enterprise Power Manager Version 1.0 User’s Guide
- Contents
- Introduction to Power Manager
- Features of Power Manager
- Compatibility for Power Manager
- License requirements for Power Manager
- Use case in Power Manager
- Getting started with Power Manager
- Maintaining Power Manager
- Viewing Metrics and Monitoring History in Power Manager
- Managing power policies
- Managing Emergency Power Reduction
- Thresholds
- Alerts
- Scalability and performance
- Widgets for Power Manager
- Reports in Power Manager
- Frequently Asked Questions
- Troubleshooting
- Other information you may need

Widgets for Power Manager
Widgets enable you to have quick access to selected groups to view their power and thermal history. Also, view the maximum
energy consumers regarding a server, chassis, and group.
Topics:
• Adding groups in OpenManage Enterprise dashboard for monitoring Power Manager related data
• Viewing Power Manager data on OpenManage dashboard
Adding groups in OpenManage Enterprise dashboard
for monitoring Power Manager related data
Add your favorite groups to quickly monitor their power and thermal data.
Identify the favorite groups for monitoring.
NOTE: You can add a maximum of three groups to the dashboard.
To add groups to OpenManage Enterprise dashboard, perform the following steps:
1. Launch OpenManage Enterprise and navigate to Widgets section—Power History or Thermal History.
2. To add a group, click Add groups.
The Add group(s) to dashboard is displayed.
3. Select the groups using the check-boxes and click Apply.
The power or thermal metric graph is added.
Viewing Power Manager data on OpenManage
dashboard
View Power Manager specific data on OpenManage Enterprise dashboard for the following list:
● Power and thermal data for selective groups
● Ratio of devices present in OpenManage Enterprise that are compatible with Power Manager to how many devices are
monitored through Power Manager
● Top five servers, chassis, and groups that consume maximum energy
1. Launch OpenManage Enterprise and navigate to Widgets section—Power History or Thermal History.
2. To view the ratio, see the Power Manager Devices Stats.
3. To view the top five energy consumers by the category of servers, chassis and groups, see Top Energy Consumers by
Server, Top Energy Consumer by Chassis, and Top Energy Consumers by Group graphs.
14
30 Widgets for Power Manager