
Users Guide
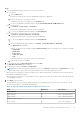
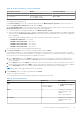
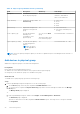
Table Of Contents
- Dell EMC OpenManage Enterprise Power Manager Version 2.0 User’s Guide
- Contents
- Introduction to Power Manager
- Revision history
- What is new in this release
- Compatibility matrix
- License requirements
- Scalability and performance
- Getting started with Power Manager
- Create a device discovery job
- Monitor and manage Power Manager devices
- Rack management
- Manage data center during power reduction
- Quick access to Power Manager data
- View power and thermal history of Power Manager groups
- View top five energy consumers
- View ratio of devices discovered in OpenManage Enterprise to devices added in Power Manager
- View top ten power offenders
- View top ten temperature offenders
- View top ten underutilized racks for power and space
- View power and space headroom
- Maintain Power Manager
- Alerts
- Reports in Power Manager
- Update Power Manager
- Frequently Asked Questions
- Troubleshooting
- Appendix
- Other information you may need

● Connection State
● Name
● Identifier
● Model
● Type
● Managed State
● Part of Group
c. Select the device, and click Add Selected.
● To add a group:
a. Select the Group option and click Select Group.
The Select Group page is displayed.
b. Click Advanced Filters.
The following filters are displayed:
● Name
● Type
c. To clear the filters, click Clear All filters.
d. Select the group and click Add Selected.
NOTE: You can select only one device or group when creating a policy.
NOTE: After you create a policy for a device, you cannot apply the policy to a group. Similarly, after creating a policy
for a group, you cannot apply the policy to a device.
5. Click Next.
6. For a static policy:
In the Policy Settings section, select the monitoring period from the Monitoring time period drop-down menu, and
provide the Power cap value, and then click Next.
Use the Power History section as a reference to set the power cap value.
● Power History for a device—displays minimum, average, and maximum power consumption with the lower and upper
bound values. The values change as you change the duration of the Monitoring time period.
● Power History for a group—displays minimum, average, and maximum power consumption with lower and upper bound
values. The minimum, average, and maximum power history of the group is the sum of all the minimum, average, and
maximum power consumption of individual devices in the group. The values change as you change the duration of
Monitoring time period. The upper and lower bound value for a group is the sum of upper bound and lower bound
values for all devices part of the group. The Power Cap displayed is the sum of all the power cap values of the devices in
the group.
Guidance for providing power cap values:
● The default Power Cap Value displayed is the upper bound value of the device. You can change the Power Cap value
and the Power Cap percentage gets populated automatically.
● If you change the percentage of Power Cap then the Power Cap value gets populated automatically.
● If you change the Percentage of Range then the Power Cap Value gets populated automatically.
●
For groups, provide the power cap value or percentage of consumption at the group level or at every device level.
● Provide the power cap value that ranges between the lower and upper bounds of the device.
NOTE:
For the following list of PowerEdge servers, the Lower Bound and Upper Bound threshold range values are
always static.
Table 15. Power cap range for servers
Generation of servers Models Value Range (Watts)
14
th
generation
● PowerEdge XE7440
● PowerEdge XE7420
● VxRail G560
● VxRail G560F
● PowerEdge C6420
● PowerEdge R6415
● PowerEdge R7415
Zero to 32767
34 Monitor and manage Power Manager devices