
Users Guide
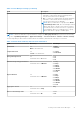
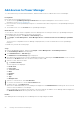
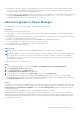
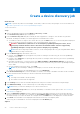
Table Of Contents
- Dell EMC OpenManage Enterprise Power Manager Version 2.0 User’s Guide
- Contents
- Introduction to Power Manager
- Revision history
- What is new in this release
- Compatibility matrix
- License requirements
- Scalability and performance
- Getting started with Power Manager
- Create a device discovery job
- Monitor and manage Power Manager devices
- Rack management
- Manage data center during power reduction
- Quick access to Power Manager data
- View power and thermal history of Power Manager groups
- View top five energy consumers
- View ratio of devices discovered in OpenManage Enterprise to devices added in Power Manager
- View top ten power offenders
- View top ten temperature offenders
- View top ten underutilized racks for power and space
- View power and space headroom
- Maintain Power Manager
- Alerts
- Reports in Power Manager
- Update Power Manager
- Frequently Asked Questions
- Troubleshooting
- Appendix
- Other information you may need

About this task
NOTE: If you are logging in as a Device Manager, only the device groups and devices that are in your scope are available for
viewing and management.
For example, if you are logging in as a Device Manager DM1 user, and a group G1 is assigned to the Device Manager DM1 user,
you can view only the virtual machines that are hosted by the devices in the G1 group.
Steps
1. Launch OpenManage Enterprise and click Plugins > Power Management > Power Manager Devices.
The Power Manager Devices tab is displayed.
2. To view the virtual machines monitored in Power Manager, expand the Virtual Machines section on the left pane.
3. To view details of a particular VM, click a VM name.
A section with all the VM details is displayed on the right pane.
4. To view the power history of a VM, click View Metrics.
The power history of the server and the VM are displayed.
5. To change the duration, expand and select the required duration from the Duration drop-down menu.
Hover your mouse pointer over the graph to view the device and VM power at a certain time.
6. To view the latest metrics, click the refresh icon.
Next steps
After migrating VMs from source to target server, if you create a VM on the source server, then the same UUID that was
allotted to the migrated VM may get assigned to the new VM. Hence, you may not see the VMs displayed in Power Manager,
if both the source and target servers are monitored. To view and monitor all the VMs hosted on servers that are monitored by
Power Manager, check and delete the VMs with conflicting UUIDs.
To view the UUIDs of VMs, perform the following steps:
1. Launch OpenManage Enterprise and click Devices.
2. Click a device name.
The device Overview page is displayed.
3. Click Hardware tab and then click Guest Information.
The VM Guest information is displayed.
Thresholds
Thresholds enable you to specify warnings and critical limits for power and temperature metrics on devices and groups. Power
Manager generates alerts through OpenManage Enterprise when the configured limits are violated. The status of power and
temperature are displayed in the form of graphs on the Power Management and Monitoring or Group Details tab.
Create alert thresholds
To monitor devices and groups for threshold violations, define the power and temperature threshold values.
Prerequisites
Ensure that you have added devices or groups to Power Manager.
About this task
NOTE:
If you are logging in as a Device Manager, only the device groups and devices that are in your scope are available for
viewing and management.
For example, if you are logging in as a Device Manager DM1 user, you can create and manage alert thresholds that are created
by any other Device Manager user only for the devices in Device Manager DM1 user scope.
To configure alert thresholds for power and temperature, perform the following steps:
30
Monitor and manage Power Manager devices