
Users Guide
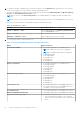
Table Of Contents
- Dell EMC OpenManage Enterprise Power Manager Version 2.0 User’s Guide
- Contents
- Introduction to Power Manager
- Revision history
- What is new in this release
- Compatibility matrix
- License requirements
- Scalability and performance
- Getting started with Power Manager
- Create a device discovery job
- Monitor and manage Power Manager devices
- Rack management
- Manage data center during power reduction
- Quick access to Power Manager data
- View power and thermal history of Power Manager groups
- View top five energy consumers
- View ratio of devices discovered in OpenManage Enterprise to devices added in Power Manager
- View top ten power offenders
- View top ten temperature offenders
- View top ten underutilized racks for power and space
- View power and space headroom
- Maintain Power Manager
- Alerts
- Reports in Power Manager
- Update Power Manager
- Frequently Asked Questions
- Troubleshooting
- Appendix
- Other information you may need

3. To change the duration, expand the metric and select a duration from the Duration drop-down menu. Hover your mouse
pointer over the graph to view the maximum, average, and minimum values.
The values are displayed according to the format that you have specified in the Monitoring Units and Metric gathering
interval in the Power Manager Preferences section.
NOTE: You can view only Instant temperature for PowerEdge M1000e, PowerEdge FX2, and PowerEdge FX2s
chassis.
NOTE: You can view only the power, temperature, and system airflow history for PowerEdge AMD processor servers.
Based on your selection, details of the granular information available are as follows:
Table 10. Granularity of data
Duration Granularity of data
6 Hours or 12 Hours or 1 Day Data is displayed based on the Metric gathering interval
set in the Preferences section.
7 Days or 1 Month Data is displayed at an interval of one hour.
3 Months or 6 Months or 1 Year Data is displayed at an interval of one day.
4. To view the latest metrics, click the refresh icon.
Table 11. List of Power Manager metrics and supported devices
Metric Supported devices
Power History (Watt)
● 12
th
and later generations of PowerEdge servers
NOTE: Cabled PSU servers are not supported.
NOTE: PowerEdge Fm120 aqua is not supported.
● PowerEdge MX7000
● PowerEdge M1000e
● PowerEdge VRTX
● PowerEdge FX2
● PowerEdge FX2s
Energy Consumption
● 12
th
and later generations of PowerEdge servers
● PowerEdge MX7000
● PowerEdge M1000e
● PowerEdge VRTX
● PowerEdge FX2
● PowerEdge FX2s
Thermal History (Celsius)
● 12
th
and later generations of PowerEdge servers
● PowerEdge MX7000
● PowerEdge M1000e
● PowerEdge VRTX
● PowerEdge FX2
● PowerEdge FX2s
CPU Utilization (%)
● 13
th
and later generations of PowerEdge Intel servers
● 15
th
and later generations of PowerEdge AMD servers
with iDRAC version 4.30.30.30 and later
I/O Utilization (%)
● 13
th
and later generations of PowerEdge servers (Intel)
Memory Bandwidth Utilization (%)
● 13
th
and later generations of PowerEdge servers (Intel)
System Airflow History (CFM)
● Nonmodular PowerEdge servers
○ The latest generation of AMD servers with iDRAC
Data Center license and iDRAC version 4.10.10.10 and
above
28 Monitor and manage Power Manager devices