
Users Guide
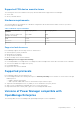
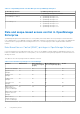
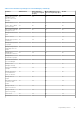
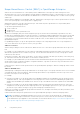

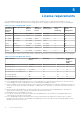


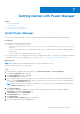
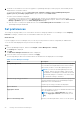
Table Of Contents
- Dell EMC OpenManage Enterprise Power Manager Version 2.0 User’s Guide
- Contents
- Introduction to Power Manager
- Revision history
- What is new in this release
- Compatibility matrix
- License requirements
- Scalability and performance
- Getting started with Power Manager
- Create a device discovery job
- Monitor and manage Power Manager devices
- Rack management
- Manage data center during power reduction
- Quick access to Power Manager data
- View power and thermal history of Power Manager groups
- View top five energy consumers
- View ratio of devices discovered in OpenManage Enterprise to devices added in Power Manager
- View top ten power offenders
- View top ten temperature offenders
- View top ten underutilized racks for power and space
- View power and space headroom
- Maintain Power Manager
- Alerts
- Reports in Power Manager
- Update Power Manager
- Frequently Asked Questions
- Troubleshooting
- Appendix
- Other information you may need

8. The details of the number of users who are logged in to OpenManage Enterprise, tasks in progress, and schedule jobs are
displayed in the confirmation window.
To confirm the installation, select the I agree that I have captured a snapshot of the OpenManage Enterprise
appliance prior to performing a plugin action. option, and then click Confirm Install.
The status of the installation is displayed.
● To instantly view the latest list of devices and groups that are part of Power Manager as a result of any license
changes made on the target devices, click Run Inventory in OpenManage Enterprise, and then click the Refresh Power
Manager capabilities option on the Power Manager Devices page.
● View the count of overall power-capable devices from the Power Manager Devices Statistics section of the
OpenManage Enterprise dashboard.
Set preferences
The settings on the page enable you to collect data for the devices and groups added to Power Manager. Set the Sampling
Intervals according to your data center recommendations and monitor your devices.
About this task
If you are logging in as a Device Manager, then you can only view the preferences that are configured by an Administrator.
To set the units and sampling intervals, perform the following steps:
Steps
1. Launch OpenManage Enterprise, and then click Plugins > Power Management > Settings.
The Settings tab is displayed.
2. Click Edit.
The Edit Power Manager Preferences window is displayed.
3. Select the values for the listed options, and then click Apply.
The following table provides more information about the attributes that are displayed in Power Manager.
Table 8. Power Manager Settings
Field Description
Data gathering interval Select the frequency to collect data from devices or groups.
Use your data center requirements such as network traffic,
and criticality of data to set the data gathering interval.
NOTE: If you have set the data gathering interval as
15 minutes, and only when the number of devices that
are added to Power Manager exceeds 1000, the interval
automatically changes to 30 minutes. You cannot return
this 30 minutes setting to 15 minutes.
Duration of top energy consumers Select the duration to view the list of devices or groups that
consume maximum energy on the OpenManage Enterprise
dashboard for the selected duration.
Only the top five energy consumers are displayed.
Report Duration View data for the selected duration.
Aggregation Period Select the frequency of the level of detailed information that
has to be displayed in reports.
NOTE: If you select a Report Duration other than 1
Day, the Aggregation Period is automatically set to 1
Day.
Delete Power Manager data Based on your data requirements, select one of the options:
20 Getting started with Power Manager