Dell EMC OpenManage Enterprise Power Manager Version 2.0 User’s Guide July 2021 Rev.
Notes, cautions, and warnings NOTE: A NOTE indicates important information that helps you make better use of your product. CAUTION: A CAUTION indicates either potential damage to hardware or loss of data and tells you how to avoid the problem. WARNING: A WARNING indicates a potential for property damage, personal injury, or death. © 2019 - 2021 Dell Inc. or its subsidiaries. All rights reserved. Dell, EMC, and other trademarks are trademarks of Dell Inc. or its subsidiaries.
Contents Chapter 1: Introduction to Power Manager.................................................................................... 6 Chapter 2: Revision history........................................................................................................... 7 Chapter 3: What is new in this release...........................................................................................8 Chapter 4: Compatibility matrix.............................................................................
Creating physical groups in OpenManage Enterprise.........................................................................................39 Add devices in physical group.................................................................................................................................. 40 Create physical groups through CSV file............................................................................................................... 41 Power Distribution Unit...............................
Edit Unmonitored Devices details........................................................................................................................... 65 Delete Unmonitored Devices.................................................................................................................................... 66 Manage PDU devices ......................................................................................................................................................
1 Introduction to Power Manager Dell EMC OpenManage Enterprise Power Manager is a plugin to the Dell EMC OpenManage Enterprise (OME) console and uses fine-grained instrumentation to provide increased visibility to power consumption, system anomalies, and resource utilization on Dell EMC servers. Also, Power Manager supports virtual machine monitoring, and alerts and reports about power and thermal events in servers, chassis, and custom groups consisting of servers and chassis.
2 Revision history Table 1. Revision history of document Date Document version Description of changes June 2021 A00 Initial release of the document. August 2021 A01 ● Updated compatible version of OpenManage Enterprise. ● Removed the iDRAC version limitation.
3 What is new in this release ● Support for monitoring Power Distribution Unit (PDU) devices. ● Support for monitoring Virtual Machines (VM) that are hosted on hypervisors that have been discovered in OpenManage Enterprise and added to Power Manager. ● Power Manager: Virtual Machine Performance Report integrated to view VM details monitored in Power Manager. ● Support for monitoring 8000 devices that include servers, PDUs, virtual machines, and 500 groups (static and physical).
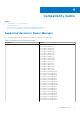
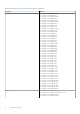
4 Compatibility matrix Topics: • • • • Supported devices in Power Manager Supported protocols Versions of Power Manager compatible with OpenManage Enterprise Role and scope-based access control in OpenManage Enterprise Supported devices in Power Manager Power Manager supports the following list of Dell EMC PowerEdge servers and chassis. Table 2.
Table 2.
Supported PDU device manufacturers The following are the Power Distribution Unit (PDU) device brands that are supported in Power Manager: ● Vertiv Geist ● APC by Schneider Electric Hardware requirements The following table lists the minimum set of hardware configurations that are based on the number of devices you want to monitor through Power Manager. Table 3. Minimum required hardware Minimum recommended hardware Large deployments Small deployments Number of devices that Power Manager can manage.
Table 4. Compatibility matrix of Power Manager and OpenManage Enterprise Power Manager Version OpenManage Enterprise Version Power Manager 2.0 ● OpenManage Enterprise 3.6 onwards Power Manager 1.1 and 1.2 ● OpenManage Enterprise 3.4 ● OpenManage Enterprise 3.4.1 ● OpenManage Enterprise 3.5 Power Manager 1.0 ● ● ● ● OpenManage OpenManage OpenManage OpenManage Enterprise Enterprise Enterprise Enterprise 3.2 3.2.1 3.3 3.3.
Table 5. Role-based user privileges for Power Manager (continued) Features Administrator Device Manager (scope for assigned groups) Device Manager (scope for non-assigned groups) Viewer Add or remove Power Distribution Units (PDUs) from Power Manager. Yes Yes No No Monitor PDUs. Yes Yes No Yes Create, edit, or delete Physical Groups. Yes No No No Import physical groups Yes through CSV file No No No Manage the devices in Yes rack. No No No Monitor metrics.
Scope-Based Access Control (SBAC) in OpenManage Enterprise With the use of Role-Based Access Control (RBAC) feature, administrators can assign roles while creating users. Roles determine their level of access to the appliance settings and device management features. Scope-based Access Control (SBAC) is an extension of the RBAC feature that allows an administrator to restrict a Device Manager role to a subset of device groups called scope.
NOTE: Post upgrade of OpenManage Enterprise from versions 3.5 or earlier, the AD/LDAP and OIDC (PingFederate or KeyCloak) device managers would need to recreate all the previous-version entities as these entities are only available to the administrators post upgrade. For more information, see the Release Notes at https://www.dell.com/support/home/ en-yu/product-support/product/dell-openmanage-enterprise/docs. SBAC for OIDC users: Scope assignment for OIDC users does not happen within the OME console.
5 License requirements Use OpenManage Enterprise Advanced license together with your iDRAC license to work with all the features of Power Manager. The following table provides the license combinations that is required to add and monitor servers in Power Manager. Table 6.
● If EPR is enabled on a group, and if the license is expired or deleted for any device in a group, the device is not removed from Power Manager. ● If EPR is enabled on a group, you cannot remove the group or any device that is part of the group from Power Manager.
6 Scalability and performance Power Manager supports up to 8,000 target devices that include 500 groups—static and physical groups, servers, virtual machines, and Power Distribution Units (PDUs). Configure appropriate power and temperature sampling intervals in Power Manager. The sampling intervals impact the system performance and footprint significantly, including network bandwidth consumption, database size, and trend graph display latency.
7 Getting started with Power Manager Topics: • • • • Install Power Manager Set preferences Add devices to Power Manager Add static groups to Power Manager Install Power Manager To monitor power and thermal data for devices or groups, install the Power Manager plugin on OpenManage Enterprise. Prerequisites Ensure that the following prerequisites are meet: ● Connectivity to the repository is successful: ○ To connect to an online repository, connect to downloads.dell.
8. The details of the number of users who are logged in to OpenManage Enterprise, tasks in progress, and schedule jobs are displayed in the confirmation window. To confirm the installation, select the I agree that I have captured a snapshot of the OpenManage Enterprise appliance prior to performing a plugin action. option, and then click Confirm Install. The status of the installation is displayed.
Table 8. Power Manager Settings (continued) Field Description ● Yes—To delete configured alert thresholds and metric data that is collected from devices and groups when they are removed from Power Manager. ● No—To retain the configured alert thresholds and metric data that is collected from devices and groups when they are removed from Power Manager.
Add devices to Power Manager To collect and monitor power and thermal utilization, and airflow data of devices, add the devices in Power Manager. Prerequisites Ensure that the following prerequisites are met: ● The devices have OpenManage Enterprise Advanced and the required management console licenses. For more information, see the License requirements. ● Devices are discovered in OpenManage Enterprise. For information about discovering devices, see OpenManage Enterprise User's Guide.
● After adding the devices or groups to Power Manager, if the server is running iDRAC version 4.40.40.0 or above (and is a supported model), Power Manager automatically enables the iDRAC’s Telemetry Streaming configuration and creates a custom Metric Report Definition for collecting data from servers. ● If the added device host Virtual Machines (VMs) and the hypervisors are compatible with Power Manager, then the VMs are listed in the Power Manager Devices tab.
8 Create a device discovery job About this task NOTE: To perform any tasks in Power Manager, ensure that you have necessary user privileges. For more information, see Role and scope based access control in OpenManage Enterprise. To discover a device: Steps 1. Launch OpenManage Enterprise and click Monitor > Discovery > Create. The Create Discovery Job dialog box is displayed. 2. In the Create Discovery Job dialog box, a default job name is populated. To change it, enter the discovery job name.
• • Schedule job field definitions Create customized device discovery job protocol for SNMP devices Schedule job field definitions ● Run now to start the job immediately. ● Run Later to specify a later date and time. ● Run On Schedule to run repeatedly based on a selected frequency. Select Daily, and then select the frequency appropriately. NOTE: By default, the job scheduler clock is reset at 12:00 A.M. everyday. The cron format does not consider the job creation time while calculating the job frequency.
9 Monitor and manage Power Manager devices This section provides high-level information to help administrators get started with Power Manager. Prerequisites Ensure that the following prerequisites are met: ● The devices are compatible with Power Manager. For more information, see List of supported devices. ● Discover the devices in Dell EMC OpenManage Enterprise. For more information about discovering devices, see OpenManage Enterprise User's Guide.
View metrics, and monitor devices and groups history View the visual representation of the data that is collected for all devices and groups that are added to Power Manager. Prerequisites Ensure that the following prerequisite is met: ● Devices or groups are added to Power Manager. For more information, see Adding devices to Power Manager and Adding groups to Power Manager.
3. To change the duration, expand the metric and select a duration from the Duration drop-down menu. Hover your mouse pointer over the graph to view the maximum, average, and minimum values. The values are displayed according to the format that you have specified in the Monitoring Units and Metric gathering interval in the Power Manager Preferences section. NOTE: You can view only Instant temperature for PowerEdge M1000e, PowerEdge FX2, and PowerEdge FX2s chassis.
Table 11. List of Power Manager metrics and supported devices (continued) Metric Supported devices NOTE: 14 th generation AMD servers with iDRAC version 4.10.10.10 and above. Virtual machines Discovery feature discovers the hypervisors hosting virtual machines (VM) along with host servers. The virtual machines are listed in Guest Information section in OpenManage Enterprise.
About this task NOTE: If you are logging in as a Device Manager, only the device groups and devices that are in your scope are available for viewing and management. For example, if you are logging in as a Device Manager DM1 user, and a group G1 is assigned to the Device Manager DM1 user, you can view only the virtual machines that are hosted by the devices in the G1 group. Steps 1. Launch OpenManage Enterprise and click Plugins > Power Management > Power Manager Devices.
Steps 1. From OpenManage Enterprise, perform one of the following steps: ● For a device: a. Click the Devices tab. All the devices that are discovered in OpenManage Enterprise are displayed. b. From the list of devices, click a device name. The details of the device are displayed on the Overview page. c. To view Power Manager-related information, click the Power Management and Monitoring tab. ● For a static group: a. Click Devices > Static Groups > Group name.
Table 13. Alert threshold range details for Watt and Celsius scale (continued) Field Mandatory Value Range Lower Warning No Limit: -10 to 60 degrees Upper Warning No Limit: -10 to 60 degrees Upper Critical No Limit: -10 to 60 degrees Table 14.
In multiple policies scenario, an active policy with a power cap value of 1000 Watts is applied on a device, and then another active policy with a power cap value of 1500 Watts is applied on the same device, the policy with power cap value of 1000 Watts is applied on the device as this policy is the most restrictive policy.
● ● ● ● ● ● ● Connection State Name Identifier Model Type Managed State Part of Group c. Select the device, and click Add Selected. ● To add a group: a. Select the Group option and click Select Group. The Select Group page is displayed. b. Click Advanced Filters. The following filters are displayed: ● Name ● Type c. To clear the filters, click Clear All filters. d. Select the group and click Add Selected. NOTE: You can select only one device or group when creating a policy.
Table 15. Power cap range for servers (continued) Generation of servers Models Value Range (Watts) ● PowerEdge R7425 13 th generation Zero to 700 ● PowerEdge C6320 ● PowerEdge C6320p For a temperature-triggered policy: In the Policy Settings section, select a monitoring period from the Monitoring time period drop-down menu, select or provide the Temperature Threshold value, and then click Next. Use the Temperature data section as a reference to set the temperature threshold value.
Table 16. Policy wizard details (continued) Field Mandatory Value Range Limit: 0–255 characters Enable No By default, the check-box is selected. Monitoring time period Yes By default, the time period is selected as 1 Day. ● Select ● Clear ● ● ● ● 1 Day 7 Days 1 Month 3 Months For static policy Power cap Yes By default, the power cap is populated with the Upper Bound value and a hundred percent.
10 Rack management Manage the physical groups hierarchy, and perform rack utilization for space and power using rack management features. Prerequisites Ensure that the following prerequisites are met: ● The devices have OpenManage Enterprise Advanced and the required management console licenses. For more information, see the License requirements. ● Devices are discovered in OpenManage Enterprise. For information about discovering devices, see OpenManage Enterprise User's Guide.
2. To add the Unmonitored Devices, click Add. The Add Unmonitored Devices page is displayed. 3. Provide the device details and click Finish. For information about each field, see the following table. Table 17. Details for Unmonitored Devices Field Description Mandatory Value Ranges Device Name Provide a unique device name. Yes Combination of characters, special characters, and numbers. Limit: 1-255 characters Description Provide brief information about the device you are adding.
Steps 1. Launch OpenManage Enterprise. 2. On the Devices page, select a device by clicking anywhere on the row except on the Name and IP Address columns. 3. Scroll down to the end of the page to view the Device Details for Power Manager section on the bottom-right side of the page. 4. Click Update Details. The Device Details for Power Manager page is displayed. 5. Provide the size of the device in the rack Unit and maximum power consumption of the device in Watts and click Apply.
Table 19. Physical group attributes details (continued) Field Description Mandatory Value Range Description Provide brief information about the physical group.
● ● ● ● Health State Power State Connection State Type Select the categories of your choice and view the filtered data. b. Click the rack name. The Manage Rack page is displayed. 2. To add devices discovered in OpenManage Enterprise, click Add To Rack Slot. The Add Device(s) To Rack Slots wizard is displayed. 3. In the Select Device(s) section, select the devices and click Next. 4. Optional: To filter and view the data, perform the following steps: a. Click Advanced Filters. b.
○ Ensure that only one device detail is entered in each row. A device is identified by a unique identifier. The identical devices are ignored while importing, and only the unique devices are added in a rack slot. ○ To place the device in a particular slot, ensure that you provide the rack slot information. ● When you are considering multiple device allocations on the same physical group hierarchy, you can duplicate the fields. However, only the rack slot and device identifier are unique fields.
b. Click PLUGIN GROUPS > Physical Hierarchy, expand until rack level and right-click the group, and select Manage Rack option. The Manage Rack page is displayed. 2. To Associate the PDUs to a rack, perform one of the following steps: ● Click the Associated Devices tab and then click Associate to Rack. The Select Device(s) wizard is displayed. NOTE: On this page only the PDUs are displayed for selection. OR ● Click the Add to Rack Slot option. The Select Device(s) wizard is displayed.
11 Manage data center during power reduction The Emergency Power Reduction (EPR) feature helps reduce power consumption of devices immediately during a power emergency. For example, if there is a power failure occurs and your devices are running on a UPS, you can apply EPR to reduce the power consumption of your managed devices. EPR also helps in preventing device damage due to overheating in an event of cooling infrastructure failure.
● For a device: a. Click the Devices tab. All the devices that are discovered in OpenManage Enterprise are displayed. b. From the list of devices, click a device name. The details of the device are displayed on the Overview page. c. To view Power Manager-related information, click the Power Management and Monitoring tab. ● For a static group: a. Click Devices > Static Groups > Group name. All the devices that are part of the static group are displayed. b.
● If temperature-triggered EPR is applied on a group or device, due to a temperature-triggered policy created by Device Manager DM1 user, then all the other Device Manager users can see the red color banner with the source of EPR.
12 Quick access to Power Manager data To quickly view Power Manager data, navigate to the OpenManage Enterprise or Power Manager dashboards. ● To quickly view power and thermal history of your favorite groups, add them to OpenManage Enterprise dashboard. For more information, see Viewing power and thermal history of Power Manager groups. ● To view top five devices or groups that consume maximum energy, see the Top Energy Consumer graph on the OpenManage Enterprise dashboard.
For example, if you are logging in as a Device Manager user, only the top five devices consuming the most energy from the groups that are assigned to Device Manager DM1 user are displayed. Steps 1. Launch OpenManage Enterprise, click Home, and then go to the Power Manager section. 2. To view the top five energy consumers, click the Top Energy Consumers tab. 3. View data regarding servers, chassis, and groups using the Filter drop-down menu.
5. Optional: To refresh the data, click the refresh option. View top ten temperature offenders Prerequisites Ensure that you have configured the power and temperature thresholds in the Alert Thresholds tab under the Power Management and Monitoring tab for devices, or under Group Details for groups.
To change the scale to the percentage, click the View drop-down menu and select the Percentage option. 4. To view the information in tabular format, click the tabular image. The respective table is displayed. 5. To refresh the data, click the Refresh option. View power and space headroom About this task NOTE: If you are logging in as a Device Manager, only the device groups and devices that are in your scope are available for viewing and management.
13 Maintain Power Manager Manage the plugin and the devices and groups added to Power Manager along with managing the alerts and thresholds. Topics: • • • • • • • • Manage Power Manager plugin Manage individual devices and static groups Manage physical groups Maintain alert thresholds Maintain policies Managing unmonitored devices Manage PDU devices Uninstalling Power Manager Manage Power Manager plugin Disable or enable the Power Manager plugin to monitor your devices for power and temperature.
Enable Power Manager All features of Power Manager are enabled in OpenManage Enterprise. The REST APIs specific to Power Manager are also enabled in OpenManage Enterprise. About this task NOTE: Enabling a plugin in OpenManage Enterprise restarts the appliance services. Steps 1. Launch OpenManage Enterprise, and click Application Settings > Console and Plugins. The Console and Plugins tab is displayed. 2. In the Power Manager section, click the Enable option. The Enable page is displayed. 3.
The following filters are displayed for the Individual Devices tab: ● ● ● ● ● ● ● ● Health State Power State Connection State Name Identifier Model Type Managed State The following filters are displayed for the All Monitored Devices tab: ● ● ● ● ● ● ● ● ● Health State Power State Connection State Name Identifier Model Type Managed State Part of Group For information about each filter, see the Appendix. 5. Optional: To clear the filters, click Clear All Filters. 6.
Remove groups To stop monitoring the groups, remove them from Power Manager. Prerequisites Ensure that the following prerequisite is met: ● The Emergency Power Reduction (EPR) option is not enabled on the specific devices that are part of the group. About this task To remove a group, perform the following steps: NOTE: If a group or a specific device in a group is removed from OpenManage Enterprise, then the changes are automatically reflected in Power Manager.
All the physical groups that are created in Power Manager are displayed with their name, location, total devices in the group, and information about when they were added to Power Manager. NOTE: The location of the physical group is displayed based on the hierarchy that is selected for this particular group at the time of creation.
View racks of physical groups About this task NOTE: If you are logging in as a Device Manager, only the device groups and devices that are in your scope are available for viewing and management. For example, if you are logging in as a Device Manager DM1 user, you can view only the devices from groups that are assigned to a Device Manager DM1 user in rack view. To view the devices in a rack, perform the following steps: Steps 1.
4. Make the changes and click Finish or Save. Delete physical group Delete physical groups that are no longer valid. Prerequisites Ensure that the Emergency Power Reduction (EPR) option is disabled on the physical group. About this task NOTE: If you are logging in as a Device Manager, only the device groups and devices that are in your scope are available for viewing and management.
● Power State ● Connection State ● Type Select the categories of your choice and view the filtered data. b. Click the rack name. The Manage Rack page is displayed. 2. Locate the device that you want to move using the vertical scroll bar of the rack and select the device. 3. Click Rearrange Rack. The Update Rack Slots page is displayed. 4. To change the slot for a device, click the drop-down menu and select an empty slot. 5. Click Finish. The device slot is updated.
4. Select the rack and click Move. The device is moved to the new rack. Remove device from rack About this task NOTE: If you are logging in as a Device Manager, only the device groups and devices that are in your scope are available for viewing and management. For example, if you are logging in as a Device Manager user, you can delete the devices from the physical groups that are assigned to you from the Indiviual Devices tab.
For example, if you are logging in as a Device Manager DM1 user, you can view and manage all the alert thresholds that are configured by any Device Manager user or Administrator on the groups and devices that are in Device Manager DM1 user's scope. To view the alert thresholds graphs for power and temperature: Steps 1. From OpenManage Enterprise, perform one of the following steps: ● For a device: a. Click the Devices tab. All the devices that are discovered in OpenManage Enterprise are displayed. b.
About this task NOTE: If you are logging in as a Device Manager, only the device groups and devices that are in your scope are available for viewing and management. For example, if you are logging in as a Device Manager DM1 user, you can view and manage all the alert thresholds that are configured by any Device Manager user or Administrator on the groups and devices that are in Device Manager DM1 user's scope. To edit the threshold values for a device or a group, perform the following steps: Steps 1.
For example, if you are logging in as a Device Manager DM1 user, you can create and manage alert thresholds that are created by any other Device Manager user only for the devices in Device Manager DM1 user scope. To delete alert thresholds, perform the following steps: Steps 1. From OpenManage Enterprise, perform one of the following steps: ● For a device: a. Click the Devices tab. All the devices that are discovered in OpenManage Enterprise are displayed. b. From the list of devices, click a device name.
Steps From OpenManage Enterprise, perform any one of the following: ● To view all the policies created in Power Manager: Click Plugins > Power Management > Policies. The Policies tab is displayed. Select your category of filters, and view the data. Following is a list of categories available: ○ State—Filters the policies based on the state of the policy. The supported filters are All, Enabled, Disabled. ○ Name—Filters the policies based on the name of the policy.
Disable policy To remove power consumption or temperature policy limits, disable the relevant policy. About this task NOTE: If you are logging in as a Device Manager, only the device groups and devices that are in your scope are available for viewing and management. For example, if you are logging in as a Device Manager DM1 user, you can disable only the policies that are created by a Device Manager DM1 user. To disable a policy, perform one of the following steps: Steps 1.
Delete policy Delete policies that are no longer required. About this task NOTE: If you are logging in as a Device Manager, only the device groups and devices that are in your scope are available for viewing and management. For example, if you are logging in as a Device Manager DM1 user, you can delete only the policies that are created by the Device Manager DM1 user.
To edit the details of a device, perform the following steps: Steps 1. Launch OpenManage Enterprise, and then click Plugins > Power Management > Power Manager Devices > UNMONITORED > Unmonitored Devices. The Unmonitored Devices tab is displayed. 2. Select a device and click Edit. For information about the values of fields, see the Details for Unmonitored Devices table in Adding Details of Unmonitored Devices. 3. Provide the details and click Finish.
2. To view the PDUs, click the Associated Devices tab. All the PDUs that are associated with this rack are listed with all details. View PDUs discovered in OpenManage Enterprise View the details of a PDU after discovering it in OpenManage Enterprise. About this task NOTE: If you are logging in as a Device Manager, only the device groups and devices that are in your scope are available for viewing and management.
3. Select the device and click Remove Device(s) option. 4. In the confirmation screen, click Yes. The PDU device is removed successfully from the rack. Uninstalling Power Manager Uninstall Power Manager and delete all the data that is collected by Power Manager. Prerequisites Ensure that the following prerequisites are met: ● The Emergency Power Reduction (EPR) is not enabled on the device. View the EPR status of all devices and groups on the Emergency Power Reduction page. ● There are no active policies.
14 Alerts An alert is helpful when monitoring thresholds and you want a notification about when the power of a device or a group exceeds the limits set on them or when there are changes to a group you are monitoring. An ● ● ● ● ● alert is generated under the following circumstances: When the values cross the defined alert thresholds When the values for a device or group come back to normal state. When the policy cap of an active policy is violated.
15 Reports in Power Manager Reports contain information about the specific devices or devices part of a group, jobs, alerts, and other elements of your data center. Power Manager supports inbuilt and user-defined reports. Download these reports to view the status of Power Manager devices and groups. You can create customized reports with Power Manager details along with other device details from OpenManage Enterprise.
The Device Metric Threshold and Device Power and Thermal Metrics columns are populated only for Power Manager devices. The Group, Group Metric Threshold, Group Policy, Group Power and Thermal Metrics, Physical Group Power Headroom, and Physical Group Space Headroom columns are populated only for Power Manager groups. 7. To sort by fields, use the Sort by drop-down menu and to sort the values in ascending and descending order, use the Direction drop-down menu.
● Power Manager: Virtual Machine Performance Report—Displays the CPU count, CPU usage, power, and energy that is consumed by Virtual Machines that are monitored in Power Manager. 2. Locate and select the report that you want to view. 3. To run and view the report, click Run. The report is displayed. 4. To download the report, click Download. The Download Report page is displayed. 5. To download the report, select the required format, and then click Finish.
16 Update Power Manager About this task To update Power Manager from OpenManage Enterprise, perform the following: Steps 1. If you are not using the latest version of OpenManage Enterprise, upgrade OpenManage Enterprise to the latest compatible version of Power Manager. For the list of compatible versions of Power Manager with OpenManage Enterprise, see Versions of Power Manager compatible with OpenManage Enterprise.
Upgrade Power Manager Prerequisites Ensure that the version of Power Manager you plan to upgrade is compatible with the OpenManage Enterprise version. For more information, see Versions of Power Manager compatible with OpenManage Enterprise. About this task To update Power Manager, perform the following steps: Steps 1. Launch OpenManage Enterprise, and click Application Settings > Console and Plugins. The Console and Plugins tab is displayed. 2. In the Power Manager section, click Update Available.
17 Frequently Asked Questions Why am I not able to view the metrics? Cause: After removing the required iDRAC or DC License, or the OpenManage Enterprise Advanced Feature license, the license-dependent features are not available on the User Interface (UI). Therefore, the metric is not available, and the values are not collected by Power Manager from the next inventory cycle.
Why do I not see all metric types for different types of devices? Cause: Different devices support different types of metrics. Table 21.
Why do I see a failure of EPR in audit log but EPR is applied successfully for the group? Cause: When EPR option is applied for a group, and if the EPR option is applied successfully for at least one device in the group, the EPR banner is displayed at the group level. However, the EPR option may fail on other devices within the group due to connectivity issues or license expiry and so on. Therefore, use the EPR audit logs for successful and failure scenarios for all devices of the group.
Why is Power Manager not listed on Console and plugins page? Cause: Power Manager may not be listed due to the following reasons: ● The offline share folder is not accessible. ● Power Manager plugin and tar folder.s are not present in the offline share folder. ● If the plugin catalog file is edited, then the signature files can get corrupted. Resolution: Ensure that the offline share folder is reachable through OpenManage Enterprise with the following files: ● ome_powermanager_1.0.0.tar.
Why do I not see temperature metric for some devices? Cause: The temperature metric is not visible for devices if they are powered off. Why can I not select a particular child group? Cause: When you select a group, all the child groups within this group are also selected. Likewise, when you clear a child group the selection gets cleared at the main group level.
Why can I not clear the checkbox for policies? Cause: The checkbox for policies in the Power Policies page is disabled if that policy is being enabled, disabled, or edited. After the job is completed, you can clear the policy. How do I see the old metric data? Cause: The old metric data is not available after a few days because the data is deleted. This configuration depends on the selection of the Delete Power Manager data option available in the Power Manager Preferences section.
18 Troubleshooting Data purge interval not reset Scenario: After reinstalling or updating to the latest version of Power Manager, the data purge interval is not reset to the default value.
Why is OpenManage Enterprise unresponsive when I try to perform plugin lifecycle-related actions (install/uninstall/ enable/disable)? Scenario: After rebooting OpenManage Enterprise appliance, if you try to perform any plugin lifecycle-related actions for Power Manager, the job is initiated in the back-end but you still see the Console and Plugins page. And, the following message is displayed after some time: This page isn't working Resolution: Wait for some time, and view the status.
When devices are simultaneously added to and removed from a static group through OpenManage Enterprise, there are multiple entries of this update in the Audit Logs and Alert Log. All options for managing physical groups are not displayed Scenario: After creating a physical group, you may not see Create New Physical Group, Edit Group, Manage Rack, Delete Group, or Attributes options when you right-click any group.
19 Appendix Here are the details about all the filters that are used in the Individual Devices tab of Power Manager. ● Health State indicates the working state of the device. The health status—OK, critical, and warning—are identified by respective color symbols. Table 22. Device health statuses in OpenManage Enterprise ● ● ● ● ● ● ● ● ● ● ● ● ● ● ● ● 84 Health status Definition Critical Indicates an occurrence of a failure of an important aspect of the device or environment.
20 Other information you may need In addition to this guide, you can access the following documents that provide more information about Dell EMC OpenManage Enterprise Power Manager and other related products. Table 23. Other information you may need Document Description Dell EMC OpenManage Enterprise Power Manager Release Notes Provides information about known issues and workarounds in Power Manager. Dell EMC OpenManage Enterprise Power Manager REST API Guide Availability 1. Go to Dell.