
Users Guide
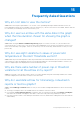
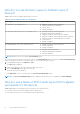

Table Of Contents
- Dell EMC OpenManage Enterprise Power Manager Version 1.2 User’s Guide
- Contents
- Introduction to Power Manager
- What is new in this release
- Compatibility matrix
- License requirements
- Scalability and performance
- Getting started with Power Manager
- Monitoring and managing Power Manager metrics
- Rack management
- Manage data center during power reduction
- Quick access to Power Manager data
- Adding or removing groups from OpenManage Enterprise dashboard to monitor Power Manager data
- View power and thermal history of Power Manager groups
- Viewing top five energy consumers
- Viewing ratio of devices discovered in OpenManage Enterprise to devices added in Power Manager
- View top ten power offenders
- View top ten temperature offenders
- View top 10 underutilized racks for power and space
- View power and space headroom
- Maintaining Power Manager
- Alerts
- Reports in Power Manager
- Updating Power Manager
- Frequently Asked Questions
- Troubleshooting
- Other information you may need

Why do I not see all metric types for different types of
devices?
Cause: Different devices support different types of metrics.
Table 18. List of supported devices and metrics
Device Type Supported Metrics
12
th
generation of PowerEdge servers
● Maximum, minimum, and average power
● Maximum and average temperature
● System airflow
● Energy consumption
13
th
generation and 14
th
generation of PowerEdge servers
● Maximum, minimum, and average power
● Maximum and average temperature
● Maximum, minimum, and average CPU utilization
● Maximum, minimum, and average Input Output utilization
● Maximum, minimum, and average Memory Utilization
● System airflow
● Energy consumption
PowerEdge M1000e, VRTX, FX2, and FX2s chassis
● Maximum, minimum, and average power
● Instant temperature
● Energy consumption
PowerEdge MX7000 chassis
● Maximum and minimum power
● Maximum and minimum temperature
● Energy consumption
NOTE: Modular servers do not support System Airflow values.
Also, if all the criteria is met and still you are not able to view Power Manager data, ensure that the Server Power Monitoring
feature is enabled on the device you are discovering. To view the discovery log of a device:
1. In OpenManage Enterprise, click Monitor > Jobs.
The Jobs page is displayed.
2. Search for the discovery type job for the device and select the job.
3. Click the View Details on the right side of the tab.
Details about the job are displayed.
In the Messages: section, check the status for Server Power Monitoring feature.
NOTE: If the Server Power Monitoring feature is disabled, then the device is not compatible with Power Manager.
Why do I see a failure of EPR in audit log but EPR is applied
successfully for the device?
Cause: Applying EPR on the target device may fail due to the following reasons:
● Connectivity issues between the appliance and the target device.
● If the target device is part of Power Manager with an expired license.
62
Frequently Asked Questions