
Users Guide
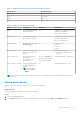
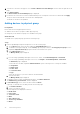
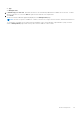
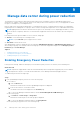
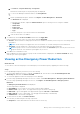
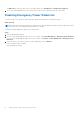
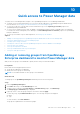
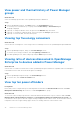
Table Of Contents
- Dell EMC OpenManage Enterprise Power Manager Version 1.2 User’s Guide
- Contents
- Introduction to Power Manager
- What is new in this release
- Compatibility matrix
- License requirements
- Scalability and performance
- Getting started with Power Manager
- Monitoring and managing Power Manager metrics
- Rack management
- Manage data center during power reduction
- Quick access to Power Manager data
- Adding or removing groups from OpenManage Enterprise dashboard to monitor Power Manager data
- View power and thermal history of Power Manager groups
- Viewing top five energy consumers
- Viewing ratio of devices discovered in OpenManage Enterprise to devices added in Power Manager
- View top ten power offenders
- View top ten temperature offenders
- View top 10 underutilized racks for power and space
- View power and space headroom
- Maintaining Power Manager
- Alerts
- Reports in Power Manager
- Updating Power Manager
- Frequently Asked Questions
- Troubleshooting
- Other information you may need
To view the top offenders, perform the following steps:
Steps
1. Launch OpenManage Enterprise and click Plugins > Power Management > Overview tab.
The Overview tab is displayed.
2. View the Top 10 Power Offenders section.
Device information that is provided by default includes details such as device name, service tag, number of times the device
has violated the defined power threshold, and nature of violations that are based on the alert threshold values defined.
3. To view the groups that have violated the power threshold, select the Groups option from the Entity Type drop-down
menu.
Device information that is provided by default includes details such as group name, number of times the group has violated
the defined power threshold, and nature of violations that are based on the alert threshold values defined.
4. To view devices or groups in a particular violation state, select an option from the State drop-down menu.
5. (Optional) To refresh the data, click the refresh option.
View top ten temperature offenders
Prerequisites
Ensure that you have configured the power and temperature thresholds in the Alert Thresholds tab under the Power
Management and Monitoring tab for devices, or under Group Details for groups.
About this task
To view a list of devices and groups that have violated the defined threshold values of power, run the in-built for Power
Manager: Metric Thresholds Report for Devices and Power Manager: Metric Thresholds Report for Groups. The
total violation count for power is the sum of upper warning, and upper critical violation counts. The total violation count for
temperature is the sum of upper warning, upper critical, lower warning, and lower critical violation counts.
To view the top offenders, perform the following steps:
Steps
1. Launch OpenManage Enterprise and click Plugins > Power Management > Overview tab.
The Overview tab is displayed.
2. To view the devices that have violated the temperature threshold, go to the Top 10 Temperature Offenders section.
Device information that is provided by default includes information such as device name, service tag, number of times the
device has violated the defined temperature threshold, and nature of violations that are based on the alert threshold values
defined.
3. To view the groups that have violated the temperature threshold, select the Groups option from the Entity Type drop-
down menu.
Device information that is provided by default includes information such as group name, service tag, number of times the
group has violated the defined temperature threshold, and nature of violations that are based on the alert threshold values
defined.
4. To view devices or groups in a particular violation state, select an option from the State drop-down menu.
5. (Optional) To refresh the data, click the refresh option.
View top 10 underutilized racks for power and space
About this task
To view the top 10 underutilized racks, perform the following steps:
Steps
1. Launch OpenManage Enterprise and click Plugins > Power Management > Overview tab.
The Overview tab is displayed.
2. To view the racks for unutilized power, go to the Top 10 Underutilized Racks (Power) graph.
By default, the Actual view is displayed.
Quick access to Power Manager data
39