
Users Guide
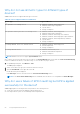
Table Of Contents
- Dell EMC OpenManage Enterprise Power Manager Version 1.1 User’s Guide
- Contents
- Introduction to Power Manager
- What's new in this release
- Compatibility matrix
- License requirements
- Scalability and performance
- Power Manager workflow
- Getting started with Power Manager
- Maintaining Power Manager
- Viewing Metrics and Monitoring History in Power Manager
- Manage data center during power reduction
- Policies
- Thresholds
- Alerts
- Widgets for Power Manager
- Adding or removing groups from OpenManage Enterprise dashboard to monitor Power Manager data
- Viewing top five energy consumers
- Viewing power and thermal history of Power Manager groups
- Viewing ratio of devices discovered in OpenManage Enterprise to devices added in Power Manager
- Viewing ratio of devices discovered in OpenManage Enterprise to devices added in Power Manager
- Viewing top ten power offenders
- Viewing top ten temperature offenders
- Reports in Power Manager
- Frequently Asked Questions
- Troubleshooting
- Other information you may need

Widgets for Power Manager
Widgets provide quick access to the power and thermal history of selective groups. They also allow you to, view the maximum
energy consumers regarding servers, chassis, and groups.
Topics:
• Adding or removing groups from OpenManage Enterprise dashboard to monitor Power Manager data
• Viewing top five energy consumers
• Viewing power and thermal history of Power Manager groups
• Viewing ratio of devices discovered in OpenManage Enterprise to devices added in Power Manager
• Viewing ratio of devices discovered in OpenManage Enterprise to devices added in Power Manager
• Viewing top ten power offenders
• Viewing top ten temperature offenders
Adding or removing groups from OpenManage
Enterprise dashboard to monitor Power Manager data
Add your favorite groups to the dashboard to quickly monitor their power and thermal data.
Prerequisites
Ensure that the following prerequisites are met:
● The groups are added in Power Manager.
● Identify the favorite groups for monitoring.
NOTE: You can add a maximum of three groups to the dashboard.
About this task
To add groups to the OpenManage Enterprise dashboard, perform the following steps:
Steps
1. Launch OpenManage Enterprise.
2. Click Home tab and go to the Power Manager section.
3. To add or remove a group to the Power History or Thermal History graphs, click Add Groups.
The Add group(s) to dashboard page is displayed.
4. (Optional) Select or clear the groups using the check-boxes and click Apply.
To filter the groups, expand Advanced Filters option. The following categories are displayed:
● Name
● Type
To clear the filters, click Clear All Filters.
The groups are updated in the selected metric graphs.
Viewing top five energy consumers
About this task
View the devices consuming most of the energy in the Power Manager section of the OpenManage Enterprise dashboard.
14
Widgets for Power Manager 43