
Users Guide
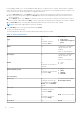
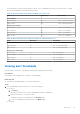
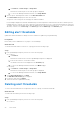
Table Of Contents
- Dell EMC OpenManage Enterprise Power Manager Version 1.1 User’s Guide
- Contents
- Introduction to Power Manager
- What's new in this release
- Compatibility matrix
- License requirements
- Scalability and performance
- Power Manager workflow
- Getting started with Power Manager
- Maintaining Power Manager
- Viewing Metrics and Monitoring History in Power Manager
- Manage data center during power reduction
- Policies
- Thresholds
- Alerts
- Widgets for Power Manager
- Adding or removing groups from OpenManage Enterprise dashboard to monitor Power Manager data
- Viewing top five energy consumers
- Viewing power and thermal history of Power Manager groups
- Viewing ratio of devices discovered in OpenManage Enterprise to devices added in Power Manager
- Viewing ratio of devices discovered in OpenManage Enterprise to devices added in Power Manager
- Viewing top ten power offenders
- Viewing top ten temperature offenders
- Reports in Power Manager
- Frequently Asked Questions
- Troubleshooting
- Other information you may need

The thresholds are saved successfully, and the scales are color coded based on the current state of the device or group.
View the following tables for each threshold value range.
Table 13. Alert threshold range details for Watt and Celsius scale
Field Mandatory Value Range
Power (Watt)
Upper Warning No Limit: 1–29307121 integers
Upper Critical No Limit: 1–29307121 integers
Temperature (Celsius)
Lower Critical No Limit: -10 - 60 degrees
Lower Warning No Limit: -10 - 60 degrees
Upper Warning No Limit: -10 -60 degrees
Upper Critical No Limit: -10 to 60 degrees
Table 14. Alert threshold range details for BTU/hour and Fahrenheit scale
Field Mandatory Value Range
Power (BTU/hour)
Upper Warning No Limit: 3–99937283 integers
Upper Critical No Limit: 3–99937283 integers
Temperature (Fahrenheit)
Lower Critical No Limit: 14-140 degrees
Lower Warning No Limit: 14-140 degrees
Upper Warning No Limit: 14-140 degrees
Upper Critical No Limit: 14-140 degrees
Viewing alert thresholds
View the status of the device or group that is based on the configured alert thresholds.
Prerequisites
Ensure that you have added devices or groups to Power Manager.
About this task
To view the alert thresholds graphs for power and temperature:
Steps
1. From OpenManage Enterprise, perform one of the following steps:
● For device:
a. Click Devices.
All the devices that are discovered in OpenManage Enterprise are displayed.
b. From the list of devices, click a device name.
The details of the device are displayed on the Overview page.
c. To view Power Manager related information, click Metrics page.
● For group:
Thresholds
39