
Users Guide
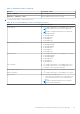
Table Of Contents
- Dell EMC OpenManage Enterprise Power Manager Version 1.1 User’s Guide
- Contents
- Introduction to Power Manager
- What's new in this release
- Compatibility matrix
- License requirements
- Scalability and performance
- Power Manager workflow
- Getting started with Power Manager
- Maintaining Power Manager
- Viewing Metrics and Monitoring History in Power Manager
- Manage data center during power reduction
- Policies
- Thresholds
- Alerts
- Widgets for Power Manager
- Adding or removing groups from OpenManage Enterprise dashboard to monitor Power Manager data
- Viewing top five energy consumers
- Viewing power and thermal history of Power Manager groups
- Viewing ratio of devices discovered in OpenManage Enterprise to devices added in Power Manager
- Viewing ratio of devices discovered in OpenManage Enterprise to devices added in Power Manager
- Viewing top ten power offenders
- Viewing top ten temperature offenders
- Reports in Power Manager
- Frequently Asked Questions
- Troubleshooting
- Other information you may need

Viewing Metrics and Monitoring History in
Power Manager
Power Manager provides a visual representation of the data that is collected for all devices and groups.
Prerequisites
Ensure that the following prerequisite is met:
● Devices or groups are added to Power Manager. For more information, see Adding devices to Power Manager and Adding
groups to Power Manager.
About this task
To view Power Manager metric, perform the following steps:
Steps
1. From OpenManage Enterprise, perform one of the following steps:
● For device:
a. Click Devices.
All the devices that are discovered in OpenManage Enterprise are displayed.
b. From the list of devices, click a device name.
The details of the device are displayed on the Overview page.
c. To view Power Manager related information, click Metrics page.
● For group:
a. Click Devices > Static Groups > Group name.
All the devices that are part of the static group are displayed.
b. To view Power Manager related information, click Group Details.
2. View metrics and monitoring data in Metrics and Monitoring History tab.
NOTE: For static groups, only the power and thermal data is displayed.
The power, thermal, CPU, Input Output, memory utilization and system airflow history is indicated in a graphical format.
3. To view a metric, expand the metric and select a duration from the Duration drop-down menu. Hover the mouse pointer
over the graph to view the maximum, average, and minimum values.
NOTE:
The values are displayed according to the format that you have specified in the Monitoring Units, and Metric
gathering interval in the Power Manager Preferences section.
NOTE: You can view only Instant temperature for PowerEdge M1000e, PowerEdge FX2, and PowerEdge FX2s
chassis.
NOTE: You can view only the power, temperature, and system airflow history for PowerEdge AMD processor servers.
Details of the granular information are as follows based on your selection:
Table 9. Granularity of data
Duration Granularity of data
6 Hours or 12 Hours or 1 Day Data is displayed based on the Metric gathering interval
set in the Preferences section.
9
26 Viewing Metrics and Monitoring History in Power Manager