
Users Guide
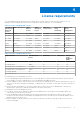
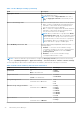
Table Of Contents
- Dell EMC OpenManage Enterprise Power Manager Version 1.1 User’s Guide
- Contents
- Introduction to Power Manager
- What's new in this release
- Compatibility matrix
- License requirements
- Scalability and performance
- Power Manager workflow
- Getting started with Power Manager
- Maintaining Power Manager
- Viewing Metrics and Monitoring History in Power Manager
- Manage data center during power reduction
- Policies
- Thresholds
- Alerts
- Widgets for Power Manager
- Adding or removing groups from OpenManage Enterprise dashboard to monitor Power Manager data
- Viewing top five energy consumers
- Viewing power and thermal history of Power Manager groups
- Viewing ratio of devices discovered in OpenManage Enterprise to devices added in Power Manager
- Viewing ratio of devices discovered in OpenManage Enterprise to devices added in Power Manager
- Viewing top ten power offenders
- Viewing top ten temperature offenders
- Reports in Power Manager
- Frequently Asked Questions
- Troubleshooting
- Other information you may need
Viewing devices and groups added to Power Manager
About this task
To view devices or groups that are added to Power Manager, perform the following steps:
Steps
1. Launch OpenManage Enterprise.
2. Click Power Management section, and then click Monitored Devices and Groups.
The Monitored Devices and Groups tab is displayed.
3. To refresh the list of devices and groups that are added, click Refresh the list for Power Manager Capabilities.
4. To view a device or a group that is added to Power Manager, perform one of the following:
● To view a static group, click the Static Groups tab.
● To view a physical group, click the Physical Groups tab.
● To view a device, click the Individual Devices tab.
● To view all the devices added to Power Manager as individual devices and as a part of groups, click the All Monitored
Devices tab.
5. To filter and view the data on any of the tabs:
a. Click a tab.
b. Click Advanced Filters.
c. Select a filter category.
The following filters are displayed for the Static Groups and Physical Groups tabs:
● Group Name
The following filters are displayed for the Individual Devices tab:
● Health State
● Power State
● Connection State
● Name
● Service Tag
● Model
● Type
● Managed State
The following filters are displayed for the All Monitored Devices tab:
● Health State
● Power State
● Connection State
● Name
● Service Tag
● Model
● Type
● Managed State
● Part of Group
6. To clear the filters, click Clear All filters.
7. To sort any column alphabetically, click the column name so that an arrow is displayed with the column name.
18
Getting started with Power Manager