
Users Guide
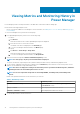

Viewing Metrics and Monitoring History in
Power Manager
Power Manager provides a visual representation of the data that is collected for all devices and groups.
Ensure that the following prerequisite is met:
• Devices or groups are added to Power Manager. For more information, see Adding devices to Power Manager and Adding groups to
Power Manager.
To view Power Manager metric, perform the following steps:
1. From OpenManage Enterprise, perform one of the following steps:
• For device:
a. Click Devices.
All the devices that are discovered in OpenManage Enterprise are displayed.
b. From the list of devices, select a device name.
The details of the device are displayed on the Overview page.
c. To view Power Manager related information, click Metrics page.
• For group:
a. Click Devices > Static Groups > Group name.
All the devices that are part of the static group are displayed.
b. To view Power Manager related information, click Group Details.
2. View metrics and monitoring data in Metrics and Monitoring History section.
NOTE: For static groups, only the power and thermal data is displayed.
The power, thermal, CPU, Input Output, memory utilization and system airflow history is indicated in a graphical format.
3. To view a metric, expand the metric and select a duration from the Duration drop-down menu. Hover the mouse pointer over the
graph to view the maximum, average, and minimum values.
NOTE:
The values are displayed according to the format that you have specified in the Monitoring Units, and Metric
gathering interval in the Power ManagerPreferences section.
NOTE: You can view only Instant temperature for PowerEdge M1000e, PowerEdge FX2, and PowerEdge FX2s
chassis.
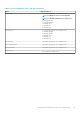
Details of the granular information are as follows based on your selection:
Table 7. Granularity of data
Duration Granularity of data
6 Hours or 12 Hours or 1 Day Data is displayed based on the Metric gathering interval set in
the Preferences section.
7 Days or 1 Month Data is displayed at an interval of one hour.
3 Months or 6 Months or 1 Year Data is displayed at an interval of one day.
4. To view the latest metrics, click the refresh icon.
8
18 Viewing Metrics and Monitoring History in Power Manager