
Users Guide
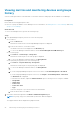
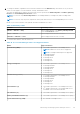
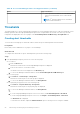
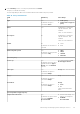
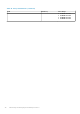

Table 10. List of Power Manager metrics and supported devices (continued)
Metric Supported devices
○ Latest generation of AMD servers with iDRAC Data
Center license and iDRAC version 4.10.10.10 and
above
NOTE: 14
th
generation AMD servers with iDRAC
version 4.10.10.10 and above.
Thresholds
Thresholds enable you to specify warnings and critical limits for power and temperature metrics on devices and groups. Power
Manager generates alerts through OpenManage Enterprise if the configured limits are violated. The status of power and
temperature are displayed in the form of graphs on the Power Management and Monitoring or Group Details tab.
Creating alert thresholds
To monitor devices and groups for threshold violations, define the power and temperature threshold values.
Prerequisites
Ensure that you have added devices or groups to Power Manager.
About this task
To configure alert thresholds for power and temperature, perform the following steps:
Steps
1. From OpenManage Enterprise, perform one of the following steps:
● For a device:
a. Click the Devices tab.
All the devices that are discovered in OpenManage Enterprise are displayed.
b. From the list of devices, click a device name.
The details of the device are displayed on the Overview page.
c. To view Power Manager-related information, click the Power Management and Monitoring tab.
● For a static group:
a. Click Devices > Static Groups > Group name.
All the devices that are part of the static group are displayed.
b. To view Power Manager-related information, click Group Details.
● For a physical group, perform one of the following steps:
a. Click Devices > Physical Hierarchy > Group name.
All the devices that are part of the physical group are displayed.
b. To view Power Manager-related information, click Group Details.
OR
a. If you are using OpenManage Enterprise version 3.4 or earlier, click Power Management > Rack View.
If you are using OpenManage Enterprise version 3.5, click Plugins > Power Management > Rack View.
The Rack View tab is displayed.
To filter and view the data, expand the Advanced Filters option. Following is a list of categories available:
24
Monitoring and managing Power Manager metrics