
Users Guide
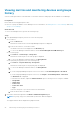

3. To change the duration, expand the metric and select a duration from the Duration drop-down menu. Hover your mouse
pointer over the graph to view the maximum, average, and minimum values.
The values are displayed according to the format that you have specified in the Monitoring Units, and Metric gathering
interval in the Power Manager Preferences section.
NOTE: You can view only Instant temperature for PowerEdge M1000e, PowerEdge FX2, and PowerEdge FX2s
chassis.
NOTE: You can view only the power, temperature, and system airflow history for PowerEdge AMD processor servers.
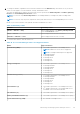
Based on your selection, details of the granular information available are as follows:
Table 9. Granularity of data
Duration Granularity of data
6 Hours or 12 Hours or 1 Day Data is displayed based on the Metric gathering interval
set in the Preferences section.
7 Days or 1 Month Data is displayed at an interval of one hour.
3 Months or 6 Months or 1 Year Data is displayed at an interval of one day.
4. To view the latest metrics, click the refresh icon.
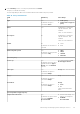
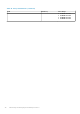
Table 10. List of Power Manager metrics and supported devices
Metric Supported devices
Power History (Watt)
● 12
th
and later generations of PowerEdge servers
NOTE: Cabled PSU servers are not supported.
NOTE: PowerEdge Fm120 aqua is not supported.
● PowerEdge MX7000
● PowerEdge M1000e
● PowerEdge VRTX
● PowerEdge FX2
● PowerEdge FX2s
Energy Consumption
● 12
th
and later generations of PowerEdge servers
● PowerEdge MX7000
● PowerEdge M1000e
● PowerEdge VRTX
● PowerEdge FX2
● PowerEdge FX2s
Thermal History (Celsius)
● 12
th
and later generations of PowerEdge servers
● PowerEdge MX7000
● PowerEdge M1000e
● PowerEdge VRTX
● PowerEdge FX2
● PowerEdge FX2s
CPU Utilization (%)
● 13
th
and later generations of PowerEdge Intel servers
● 15
th
and later generations of Poweredge AMD servers
with iDRAC version 4.30.30.30 and later
I/O Utilization (%)
● 13
th
and later generations of PowerEdge servers (Intel)
Memory Bandwidth Utilization (%)
● 13
th
and later generations of PowerEdge servers (Intel)
System Airflow History (CFM)
● Non-modular PowerEdge servers
Monitoring and managing Power Manager metrics 23