Dell EMC OpenManage Enterprise Power Manager Version 1.2 User’s Guide July 2020 Rev.
Notes, cautions, and warnings NOTE: A NOTE indicates important information that helps you make better use of your product. CAUTION: A CAUTION indicates either potential damage to hardware or loss of data and tells you how to avoid the problem. WARNING: A WARNING indicates a potential for property damage, personal injury, or death. © 2019 - 2020 Dell Inc. or its subsidiaries. All rights reserved. Dell, EMC, and other trademarks are trademarks of Dell Inc. or its subsidiaries.
Contents Chapter 1: Introduction to Power Manager.................................................................................... 6 Chapter 2: What's new in this release............................................................................................7 Chapter 3: Compatibility matrix.................................................................................................... 8 Supported devices in Power Manager.............................................................................
Adding or removing groups from OpenManage Enterprise dashboard to monitor Power Manager data...................................................................................................................................................................................39 Viewing power and thermal history of Power Manager groups.............................................................................40 Viewing top five energy consumers....................................................................
Chapter 14: Updating Power Manager..........................................................................................62 Configuring OpenManage Enterprise for Power Manager updates......................................................................62 Upgrading Power Manager............................................................................................................................................. 63 Chapter 15: Frequently Asked Questions...............................................
1 Introduction to Power Manager Dell EMC OpenManage Enterprise Power Manager is an extension or a plugin to the Dell EMC OpenManage Enterprise (OME) console and uses fine-grained instrumentation to provide increased visibility to power consumption, anomalies, and utilization. Also, Power Manager alerts and reports about power and thermal events in servers, chassis, and custom groups consisting of servers and chassis.
2 What's new in this release ● ● ● ● ● ● ● ● ● Support for creating and maintaining physical groups to replicate the data center structure. Support for rack view to visualize the physical groups. Support for airflow metric for static and physical groups. Support for defining the device size in a rack. Support for adding device details for rack management. In-built and custom power and space headroom reports for physical groups. Support for adding unmonitored devices in Power Manager.
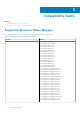
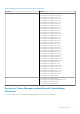
3 Compatibility matrix Topics: • • Supported devices in Power Manager Role-based user privileges for Power Manager Supported devices in Power Manager Power Manager supports the following list of Dell EMC PowerEdge servers and chassis. Table 1.
Table 1.
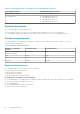
Table 2. Compatibility matrix of Power Manager and OpenManage Enterprise Power Manager Version OpenManage Enterprise Version Power Manager 1.1 and 1.2 OpenManage Enterprise 3.4 Power Manager 1.0 ● ● ● ● OpenManage OpenManage OpenManage OpenManage Enterprise Enterprise Enterprise Enterprise 3.2 3.2.1 3.3 3.3.1 Supported protocols Power Manager supports the following protocols: ● Power Manager supports only Web Services for Management (WSMAN) protocol for servers and chassis.
Role-based user privileges for Power Manager Assigning roles to each user enables you to apply Role-based Access Control(RBAC) and restrict user access to Power Manager and device management features. The following table provides a list of different user roles and their permissions. Table 4.
4 License requirements Use OpenManage Enterprise Advanced license together with your iDRAC license to work with all the features of Power Manager. The following table provides the license combinations that are required to use Power Manager. Table 5.
● If EPR is enabled on a group, you cannot remove the group or any device that is part of the group from Power Manager.
5 Scalability and performance Power Manager supports up to 6,000 target devices including 500 groups—static and physical groups. It is important to configure appropriate power and temperature sampling intervals in Power Manager The sampling intervals impact the system performance and footprint significantly, including network bandwidth consumption, database size, and trend graph display latency. The default power and temperature intervals in Power Manager are 15 minutes.
6 Getting started with Power Manager Topics: • • • • Installing Power Manager Setting preferences Adding devices to Power Manager Adding static groups to Power Manager Installing Power Manager To monitor power and thermal data for devices or groups, install the Power Manager plugin on OpenManage Enterprise. Prerequisites Ensure that the following prerequisite is met: ● Connectivity to the repository is successful: ○ To connect to an online repository, connect to downloads.dell.com portal.
The status of the installation is displayed. ● To instantly view the latest list of devices and groups that are part of Power Manager as a result of any license changes made on the target devices, click Run Inventory in OpenManage Enterprise, and then click the Refresh Power Manager capabilities option on the Power Manager Settings page. ● View the count of overall power-capable devices from the Power Manager Devices Statistics section of the OpenManage Enterprise dashboard.
Table 7. Power Manager Settings (continued) Field Description ● Yes—To delete configured alert thresholds and metric data that is collected from devices and groups when they are removed from Power Manager. ● No—To retain the configured alert thresholds and metric data that is collected from devices and groups when they are removed from Power Manager.
Table 8. Details about mandatory data intervals and duration (continued) Field Mandatory Value Range Aggregation Period Yes 1 Day The default value is 1 Day. Delete Power Manager data Yes The default value is No. Reset WSMAN power metric data Yes The default value is Disabled. ● Yes ● No ● Disabled ● Enabled Adding devices to Power Manager To collect and monitor power and thermal utilization, and airflow data of devices, add the devices in Power Manager.
● ● ● ● ● ● ● ● Health State Power State Connection State Name Service Tag Model Type Managed State 6. (Optional) To clear the filters, click Clear All filters. 7. To view the selected devices, click Selected Devices tab. 8. To add the devices, click Add Selected. All the devices added individually to Power Manager are displayed on the Individual Devices tab along with the total count of devices that are added to Power Manager.
All the individual devices and devices that are part of the selected group, are added to Power Manager, and are displayed on the All Monitored Devices tab along with the total count of devices. Next steps If the static groups were created and devices were added to the groups in OpenManage Enterprise before installing Power Manager, and when you add the groups to Power Manager, the total number of servers present in the group is displayed as zero.
7 Monitoring and managing Power Manager metrics This section provides high-level information to help administrators get started with Power Manager. Prerequisites Ensure that the following prerequisites are met: ● The devices are compatible with Power Manager. For more information, see List of supported devices. ● Discover the devices in Dell EMC OpenManage Enterprise. For more information about discovering devices, see OpenManage Enterprise User's Guide.
Viewing metrics and monitoring devices and groups history View the visual representation of the data that is collected for all devices and groups that are added to Power Manager. Prerequisites Ensure that the following prerequisite is met: ● Devices or groups are added to Power Manager. For more information, see Adding devices to Power Manager and Adding groups to Power Manager. About this task To view Power Manager metrics, perform the following steps: Steps 1.
3. To change the duration, expand the metric and select a duration from the Duration drop-down menu. Hover your mouse pointer over the graph to view the maximum, average, and minimum values. The values are displayed according to the format that you have specified in the Monitoring Units, and Metric gathering interval in the Power Manager Preferences section. NOTE: You can view only Instant temperature for PowerEdge M1000e, PowerEdge FX2, and PowerEdge FX2s chassis.
Table 10. List of Power Manager metrics and supported devices (continued) Metric Supported devices ○ Latest generation of AMD servers with iDRAC Data Center license and iDRAC version 4.10.10.10 and above NOTE: 14 th generation AMD servers with iDRAC version 4.10.10.10 and above. Thresholds Thresholds enable you to specify warnings and critical limits for power and temperature metrics on devices and groups. Power Manager generates alerts through OpenManage Enterprise if the configured limits are violated.
○ ○ ○ ○ ○ Group Name Health State Power State Connection State Type Select the categories of your choice and view the filtered data. b. Click the device name or IP address. 2. To set thresholds, click the Alert Thresholds tab, and click Edit. The Edit Alert Thresholds page is displayed. 3. Provide threshold values for Power and Temperature.
Policies Power Manager supports two types of policies you can use to monitor power and temperature of your data center devices. Static policy A static policy contains various settings that help regulate the power consumption of a specific device or a group. A power management policy is useful in different situations. For example, you can create a policy to: ● Ensure that power consumption does not exceed the capacity of the circuit.
The Create Policy wizard is displayed. 4. In the General section, provide the following information and click Next. a. In Type, select the type of policy. ● ○ Static policy—Applies a cap on the power consumption of a device or group. ○ Temperature-triggered policy—Applies Emergency Power Reduction (EPR) on a group of devices when its temperature equals or exceeds a specified value. NOTE: After a policy is created, you cannot change the type of policy.
bound values for all devices part of the group. The Power Cap displayed is the sum of all the power cap values of the devices in the group. Guidance for providing power cap values: ● The default Power Cap Value displayed is the upper bound value of the device. You can change the Power Cap value and the Power Cap percentage gets populated automatically. ● If you change the percentage of Power Cap then the Power Cap value gets populated automatically.
9. In the Summary section, view the policy details and click Finish. The policy is created successfully. The following table provides more information about all the fields in the policy wizard. Table 14. Policy wizard details Field Mandatory Value Range Type Yes ● Static policy ● Temperature-triggered policy By default, the type is selected as Static.
Table 14.
8 Rack management Manage the physical groups hierarchy, and perform rack utilization for space and power using rack management feature. Prerequisites Ensure that the following prerequisites are met: ● The devices have the required management console license. For more information, see the License requirements section. ● Servers have an OpenManage Enterprise Advanced license. For information about adding the license, see OpenManage Enterprise User's Guide. ● Devices are discovered in OpenManage Enterprise.
3. To add the Unmonitored Devices, click Add. The Add Unmonitored Devices page is displayed. 4. Provide the device details and click Finish. For information about each field, see the following table. Table 15. Details for Unmonitored Devices Field Description Mandatory Value Ranges Device Name Provide a unique device name. Yes Combination of characters, special characters, and numbers. Limit: 1-255 characters Description Provide brief information about the device you are adding.
Steps 1. Launch OpenManage Enterprise. 2. On the Devices page, in the left pane expand the PLUGIN GROUPS section. 3. In the Physical Hierarchy section, click more options, and then click Create New Physical Group. The Create New Physical Group page is displayed. 4. Provide a name and description for the group, select the Group Hierarchy and Parent Group with the defined power capacity. When selecting the Group Hierarchy and Parent Group fields, ensure that you follow the following hierarchy. Table 16.
Adding device details About this task To add or edit the device details, perform the following steps: Steps 1. Launch OpenManage Enterprise. 2. On the Devices page, select a device by clicking anywhere on the row except on Name and IP Address columns. 3. Scroll down to the end of the page to view the Device Details for Power Manager section at bottom right side of the page. 4. Click Update Details. The Device Details for Power Manager page is displayed. 5.
a. Click Advanced Filters. b. Select your category of filters. The following filters are displayed for devices: ● ● ● ● ● ● ● ● ● Health State Power State Connection State Name Size of Device (U) Service Tag / Identifier Model Type Managed State 4. In Add device(s) to rack slots, by default, the devices are automatically added in the available slots in the rack. To add a device at a specific slot, select the Auto drop-down menu and select the required slot. 5. Click Finish.
9 Manage data center during power reduction The Emergency Power Reduction (EPR) feature helps reduce power consumption of devices immediately during a power emergency. For example, if there is a power failure occurs and your devices are running on a UPS, you can apply EPR to reduce the power consumption of your managed devices. EPR also helps in preventing device damage due to overheating in an event of cooling infrastructure failure.
● For a physical group, perform one of the following steps: a. Click Devices > Physical Hierarchy > Group name. All the devices that are part of the physical group are displayed. b. To view Power Manager-related information, click Group Details. OR a. If you are using OpenManage Enterprise version 3.4 or earlier, click Power Management > Rack View. If you are using OpenManage Enterprise version 3.5, click Plugins > Power Management > Rack View. The Rack View tab is displayed.
● CREATED ON—Time the EPR was applied. b. To filter and view the data, click Advanced Filters. You can filter your data using the following components: ● Assigned To—Filters EPRs based on the device name or service tag. ● EPR Source—Filters the EPR source. The supported filters are, All, Manual, and Temperature-triggered. c. To sort any column alphabetically, click a column name so that an arrow is displayed with the column name.
10 Quick access to Power Manager data To quickly view Power Manager data, navigate to the OpenManage Enterprise or Power Manager dashboards. ● To quickly view power and thermal history of your favorite groups, add them to OpenManage Enterprise dashboard. For more information, see Viewing power and thermal history of Power Manager groups. ● To view top five devices or groups that consume maximum energy, see the Top Energy Consumer graph on the OpenManage Enterprise dashboard.
To clear the filters, click Clear All Filters. The groups are updated in the selected metric graphs. Viewing power and thermal history of Power Manager groups About this task View Power Manager-specific data on the OpenManage Enterprise dashboard. Steps 1. Launch OpenManage Enterprise, and go to Power Manager section. 2. To view the power or thermal history of a group, click the Power History or Thermal History tab. The graph is displayed. 3.
About this task To view a list of devices and groups that have violated the defined threshold values of power, run the in-built for Power Manager: Metric Thresholds Report for Devices and Power Manager: Metric Thresholds Report for Groups. The total violation count for power is the sum of upper warning, and upper critical violation counts. The total violation count for temperature is the sum of upper warning, upper critical, lower warning, and lower critical violation counts.
Viewing top 10 underutilized racks for power and space About this task To view the top 10 underutilized racks, perform the following steps: Steps 1. Launch OpenManage Enterprise. 2. If you are using OpenManage Enterprise version 3.4 or earlier, click Power Management > Overview tab. If you are using OpenManage Enterprise version 3.5, click Plugins > Power Management > Overview tab. The Overview tab is displayed. 3.
11 Maintaining Power Manager Manage the plugin and the devices and groups added to Power Manager along with managing the alerts and thresholds. Topics: • • • • • • Managing Power Manager plugin Managing individual devices and static groups Managing physical groups Maintaining alert thresholds Maintaining policies Managing unmonitored devices Managing Power Manager plugin Disable or enable the Power Manager plugin to monitor your devices for power and temperature.
Results After disabling Power Manager, you cannot see any information or pages that are related to Power Manager in OpenManage Enterprise. Enabling Power Manager All functionalities of Power Manager are enabled in OpenManage Enterprise. The REST APIs specific to Power Manager are also enabled in OpenManage Enterprise. About this task NOTE: Enabling a plugin in OpenManage Enterprise restarts the appliance services. Steps 1. Launch OpenManage Enterprise. 2. If you are using OpenManage Enterprise version 3.
● To view all the devices added to Power Manager as individual devices and as a part of groups, click the All Monitored Devices tab. 5. (Optional) To filter and view the data on any of the tabs: a. Click a tab. b. Click Advanced Filters. c. Select a filter category.
If you are using OpenManage Enterprise version 3.5, click Plugins > Power Management > Monitored Devices and Groups. The Monitored Devices and Groups tab is displayed. 3. Click the Individual Devices tab. The Individual Devices tab is displayed. 4. Select the devices that you want to remove and click Remove Device(s). The Remove Device confirmation window is displayed. 5. To confirm removal, click Remove. The devices are removed from Power Manager.
Steps 1. Launch OpenManage Enterprise. 2. On the Devices page, in the left pane expand the PLUGIN GROUPS section. 3. To view the groups, expand the Physical Hierarchy section. Viewing devices added in rack About this task To view the devices added in a rack of a physical group, perform the following steps: Steps 1. Launch OpenManage Enterprise and perform one of the following steps: a. On the Devices page, in the left pane expand the PLUGIN GROUPS section. b.
● Type Select the categories of your choice and view the filtered data. 3. To view the Power Management and Monitoring details of a device that is monitored by Power Manager, click the device name. NOTE: Some devices that are part of a physical group do not have a link because, the device is not Power Manager capable. The Power Management and Monitoring details for the device are displayed.
Rearranging rack slot of devices About this task To rearrange the rack slot of the devices in a rack, perform the following steps: Steps 1. Launch OpenManage Enterprise and perform one of the following steps: a. On the Devices page, in the left pane expand the PLUGIN GROUPS section. b. To view the devices, expand the Physical Hierarchy group until a rack level and click more options. c. Select Manage Rack option. The Manage Rack page is displayed. Or a. If you are using OpenManage Enterprise version 3.
The Rack View page is displayed. To filter and view the data, expand the Advanced Filters option. Following is a list of categories available: ● ● ● ● ● Group Name Health State Power State Connection State Type Select the categories of your choice and view the filtered data. b. Click the rack name. The Manage Rack page is displayed. 2. To move the device to another rack, click Move Device to Another Rack. The Select Group page is displayed. 3.
Maintaining alert thresholds Viewing alert thresholds View the status of the device or group that is based on the configured alert thresholds. Prerequisites Ensure that you have added devices or groups to Power Manager. About this task To view the alert thresholds graphs for power and temperature: Steps 1. From OpenManage Enterprise, perform one of the following steps: ● For a device: a. Click the Devices tab. All the devices that are discovered in OpenManage Enterprise are displayed. b.
The upper and lower warning and critical values are displayed only if the threshold values are set. To view more information about any violations, see the Alert Log on the Alerts page and the Audit Logs on the Monitor page. Editing alert thresholds Update alert thresholds based on changes to device utilization or updates in group membership. Prerequisites Ensure that you have added devices or groups to Power Manager.
Deleting alert thresholds To remove the thresholds that are configured on devices or groups, clear all the thresholds. About this task To delete alert thresholds, perform the following steps: Steps 1. From OpenManage Enterprise, perform one of the following steps: ● For a device: a. Click the Devices tab. All the devices that are discovered in OpenManage Enterprise are displayed. b. From the list of devices, click a device name. The details of the device are displayed on the Overview page. c.
Maintaining policies Viewing policy View all the policies that are created for devices and groups in Power Manager. About this task To view a policy, perform the following steps: Steps From OpenManage Enterprise, perform any one of the following: ● To view all the policies created in Power Manager: If you are using OpenManage Enterprise verison 3.4 or earlier, click Power Management > Policies. If you are using OpenManage Enterprise verison 3.5, click Plugins > Power Management > Policies.
Steps 1. If you are using OpenManage Enterprise version 3.4 or earlier, click Power Management > Policies. If you are using OpenManage Enterprise version 3.5, click Plugins > Power Management > Policies. The Policies tab is displayed. 2. Select a policy and click Edit. The power policy wizard is displayed. For more information about each field in the wizard, see Creating policy. 3. To save your changes, click Finish. The changes are saved successfully.
Deleting policy Delete policies that are no longer required. About this task When an active policy is deleted, any power consumption restrictions or temperature thresholds that are applied by the policy are also deleted. NOTE: If you delete an active temperature-triggered policy, the Emergency Power Reduction (EPR) is automatically removed on the group. To delete a policy, perform the following steps: Steps 1. If you are using OpenManage Enterprise version 3.4 or earlier, click Power Management > Policies.
Deleting Unmonitored Devices About this task To delete an unmonitored device, perform the following steps: Steps 1. Launch OpenManage Enterprise. 2. If you are using OpenManage Enterprise version 3.4 or earlier, in Power Management, click Unmonitored Devices. If you are using OpenManage Enterprise version 3.5, click Plugins, Power Management, and then click Unmonitored Devices. The Unmonitored Devices tab is displayed. 3. Select the devices you want to delete and click Delete. 4.
12 Alerts An alert is helpful when monitoring thresholds and you want a notification about when the power of a device or a group exceeds the limits set on them or when there are changes to a group you are monitoring. An alert is generated under the following circumstances: ● ● ● ● ● When When When When When the values cross the defined alert thresholds the values for a device or group come back to normal state. the policy cap of an active policy is violated.
13 Reports in Power Manager Reports contain information about the specific devices or devices part of a group, jobs, alerts, and other elements of your data center. Power Manager supports in built and user-defined reports. Download these reports to view the status of Power Manager devices and groups. You can create customized reports with Power Manager details along with other device details from OpenManage Enterprise.
7. To sort by fields, use the Sort by drop-down menu and to sort the values in ascending and descending order, use the Direction drop-down menu. ● If you have selected any column from the Metric Threshold collection, select the Metric Type of information you want to see. ● If you have selected any column from the Power and Thermal Metrics collection, select the Report Duration and Aggregation Period to view the information.
● PDF ● XLS The report is downloaded in the selected format.
14 Updating Power Manager About this task To update Power Manager from OpenManage Enterprise, perform the following: Steps 1. Configure the location of repository to check for updates. For more information, see Configuring OpenManage Enterprise for Power Manager updates. 2. Upgrade Power Manager. For more information, see Upgrading Power Manager.
Upgrading Power Manager Prerequisites Ensure that the new version of Power Manager is compatible with OpenManage Enterprise. About this task To update Power Manager, perform the following steps: Steps 1. Launch OpenManage Enterprise. 2. If you are using OpenManage Enterprise version 3.4 or earlier, in Application Settings, click Console and Extensions. The Console and extensions page is displayed. If you are using OpenManage Enterprise version 3.5, in Application Settings, click Console and Plugins.
15 Frequently Asked Questions Why am I not able to view the metrics? Cause: After removing the required iDRAC or DC License, or the OpenManage Enterprise Advanced Feature license, the license-dependent features are not available on the User Interface (UI). Therefore, the metric is not available, and the values are not collected by Power Manager from the next inventory cycle.
Why do I not see all metric types for different types of devices? Cause: Different devices support different types of metrics. Table 18.
Why do I see a failure of EPR in audit log but EPR is applied successfully for the group? Cause: When EPR option is applied for a group, and if the EPR option is applied successfully for at least one device in the group, the EPR banner is displayed at the group level. However, the EPR option may fail on other devices within the group due to connectivity issues or license expiry and so on. Therefore, use the EPR audit logs for successful and failure scenarios for all devices of the group.
Why is Power Manager not listed on Console and plugins page? Cause: Power Manager may not be listed due to the following reasons: ● The offline share folder is not accessible. ● Power Manager plugin and tar folder.s are not present in the offline share folder. ● If the plugin catalog file is edited, then the signature files can get corrupted. Resolution: Ensure that the offline share folder is reachable through OpenManage Enterprise with the following files: ● ome_powermanager_1.0.0.tar.
Why do I not see temperature metric for some devices? Cause: The temperature metric is not visible for devices if they are powered off. Why can I not select a particular child group? Cause: When you select a group, all the child groups within this group are also selected. Likewise, when you clear a child group the selection gets cleared at the main group level.
Why can I not clear the checkbox for policies? Cause: The checkbox for policies in the Power Policies page is disabled if that policy is being enabled, disabled, or edited. After the job is completed, you can clear the policy. How do I see the old metric data? Cause: The old metric data is not available after a few days because the data is deleted. This configuration depends on the selection of the Delete Power Manager data option available in the Power Manager Preferences section.
16 Troubleshooting Data purge interval not reset Scenario: After reinstalling or updating to the latest version of Power Manager, the data purge interval is not reset to the default value.
Why is OpenManage Enterprise unresponsive when I try to perform plugin lifecycle-related actions (install/uninstall/ enable/disable)? Scenario: After rebooting OpenManage Enterprise appliance, if you try to perform any plugin lifecycle-related actions for Power Manager, the job is initiated in the back-end but you still see the Console and Plugins or Console and Extensions page.
Resolution: When there are updates to the static group membership through OpenManage Enterprise, there are multiple entries of this update in the Audit Logs and Alert Log. All options for managing physical groups are not displayed Scenario: After creating a physical group, you may not see Create New Physical Group, Edit Group, Manage Rack, Delete Group, or Attributes options when you click more options. Resolution: As a workaround, wait for some time or refresh the page, and then click more options.
17 Other information you may need In addition to this guide, you can access the following documents that provide more information about Dell EMC OpenManage Enterprise Power Manager and other related products. Table 19. Other information you may need Document Description Dell EMC OpenManage Enterprise Power Manager Release Notes Provides information about known issues and workarounds in Power Manager. Dell EMC OpenManage Enterprise Power Manager REST API Guide Availability 1. Go to Dell.