
Users Guide

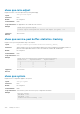


Table Of Contents
- Dell EMC SmartFabric OS10 User Guide Release 10.5.0
- Change history
- Getting Started
- CLI Basics
- CONFIGURATION mode
- Check device status
- Command help
- Candidate configuration
- Copy running configuration
- Restore startup configuration
- Reload system image
- Filter show commands
- Common OS10 commands
- boot
- commit
- configure
- copy
- delete
- dir
- discard
- do
- end
- exit
- hostname
- license
- lock
- management route
- move
- no
- ping
- ping6
- reload
- show boot
- show candidate-configuration
- show environment
- show inventory
- show ip management-route
- show ipv6 management-route
- show license status
- show running-configuration
- show startup-configuration
- show system
- show version
- start
- system
- system-cli disable
- system-user linuxadmin disable
- system identifier
- terminal
- traceroute
- unlock
- username password role
- write
- Advanced CLI tasks
- Zero-touch deployment
- OS10 provisioning
- SmartFabric Services
- SmartFabric Services personalities
- SmartFabric Services for leaf and spine
- SmartFabric Services Components
- SmartFabric Services logical entities
- Enable SmartFabric Services on the switches
- SmartFabric Services Graphical User Interface
- Configure SmartFabric Services initial setup
- Update Default Fabric, Switch Names, and Descriptions wizard
- Create Uplink for External Network Connectivity wizard
- Breakout Switch Ports wizard
- Configure Jump Host wizard
- Update Network Configuration wizard
- Onboard a Server onto the Fabric wizard
- Edit Default Fabric Settings wizard
- Fabric operations and life cycle management
- SmartFabric commands
- SmartFabric Director
- System management
- System banners
- User session management
- Telnet server
- Simple Network Management Protocol
- System clock
- Network Time Protocol
- Dynamic Host Configuration Protocol
- Packet format and options
- DHCP server
- Automatic address allocation
- Hostname resolution
- Manual binding entries
- DHCP relay agent
- View DHCP Information
- System domain name and list
- DHCP snooping
- DHCP commands
- DHCP snooping commands
- arp inspection
- arp inspection-trust
- arp inspection violation logging
- clear ip arp inspection statistics
- clear ip dhcp snooping binding
- ip dhcp snooping (global)
- ip dhcp snooping (interface)
- ip dhcp snooping binding
- ip dhcp snooping trust
- ip dhcp snooping verify mac-address
- show ip arp inspection database
- show ip arp inspection statistics
- show ip arp inspection logging
- show ip dhcp snooping binding
- DNS commands
- IPv4 DHCP limitations
- Interfaces
- Ethernet interfaces
- Unified port groups
- Z9264F-ON port-group profiles
- Port-groups on S5200F-ON switches
- L2 mode configuration
- L3 mode configuration
- Fibre Channel interfaces
- Management interface
- VLAN interfaces
- User-configured default VLAN
- VLAN scale profile
- Loopback interfaces
- Port-channel interfaces
- Configure interface ranges
- Switch-port profiles
- Configure negotiation modes on interfaces
- Configure breakout mode
- Breakout auto-configuration
- Reset default configuration
- Forward error correction
- Energy-efficient Ethernet
- View interface configuration
- Digital optical monitoring
- Interface commands
- channel-group
- default interface
- default vlan-id
- description (Interface)
- duplex
- enable dom
- enable dom traps
- feature auto-breakout
- fec
- interface breakout
- interface ethernet
- interface loopback
- interface mgmt
- interface null
- interface port-channel
- interface range
- interface vlan
- link-bundle-utilization
- mode
- mode l3
- mtu
- negotiation
- port mode Eth
- port-group
- profile
- scale-profile vlan
- show discovered-expanders
- show interface
- show interface transceiver “Tunable wavelength”
- show inventory media
- show link-bundle-utilization
- show port-channel summary
- show port-group
- show switch-port-profile
- show system
- show unit-provision
- show vlan
- shutdown
- speed (Fibre Channel)
- speed (Management)
- switch-port-profile
- switchport access vlan
- switchport mode
- switchport trunk allowed vlan
- unit-provision
- wavelength
- PowerEdge MX Ethernet I/O modules
- Fibre Channel
- Fibre Channel over Ethernet
- Terminology
- Virtual fabric
- Fibre Channel zoning
- F_Port on Ethernet
- Pinning FCoE traffic to a specific port of a port-channel
- Multi-hop FIP-snooping bridge
- Configuration guidelines
- NPIV Proxy Gateway cascading
- Support for untagged VLAN in FCoE
- F_Port commands
- NPG commands
- F_Port and NPG commands
- FIP-snooping commands
- FCoE commands
- Layer 2
- 802.1X
- Far-end failure detection
- Link Aggregation Control Protocol
- Link Layer Discovery Protocol
- Optional TLVs
- Basic TLVs
- Organizationally specific TLVs
- Media endpoint discovery
- Network connectivity device
- LLDP-MED capabilities TLV
- Network policies TLVs
- Define network policies
- Packet timer values
- Disable and enable LLDP
- Disable and enable LLDP on management ports
- Advertise TLVs
- Network policy advertisement
- Fast start repeat count
- View LLDP configuration
- Adjacent agent advertisements
- Time to live
- Advertise management address TLVs in a VLT domain
- LLDP commands
- clear lldp counters
- clear lldp table
- lldp enable
- lldp holdtime-multiplier
- lldp med fast-start-repeat-count
- lldp med
- lldp med network-policy
- lldp med network-policy (Interface)
- lldp med tlv-select
- lldp port-description-tlv advertise
- lldp receive
- lldp reinit
- lldp timer
- lldp tlv-select basic-tlv
- lldp management-addr-tlv virtual-ip
- lldp tlv-select dot1tlv
- lldp tlv-select dot3tlv
- lldp transmit
- lldp vlan-name-tlv allowed vlan
- show lldp interface
- show lldp errors
- show lldp med
- show lldp neighbors
- show lldp timers
- show lldp tlv-select interface
- show lldp traffic
- show nework-policy profile
- Media Access Control
- Spanning-tree protocol
- EdgePort
- Spanning-tree extensions
- Recover from BPDU guard violations
- MAC flush optimization
- Debug configurations
- Setting spanning-tree link type for rapid state transitions
- Common STP commands
- clear spanning-tree counters
- debug spanning-tree
- errdisable detect cause bpduguard
- errdisable recovery cause bpduguard
- errdisable recovery interval
- clear spanning-tree detected-protocol
- spanning-tree bpdufilter
- spanning-tree bpduguard
- spanning-tree disable
- spanning-tree guard
- spanning-tree link-type
- spanning-tree mac-flush-timer
- spanning-tree mode
- spanning-tree port
- show errdisable
- show spanning-tree interface
- Rapid per-VLAN spanning-tree plus
- Load balance and root selection
- Enable RPVST+
- Select the root bridge
- Root assignment
- Global parameters
- RPVST+ commands
- show spanning-tree vlan
- spanning-tree vlan cost
- spanning-tree vlan disable
- spanning-tree vlan forward-time
- spanning-tree vlan force-version
- spanning-tree vlan hello-time
- spanning-tree vlan mac-flush-threshold
- spanning-tree vlan max-age
- spanning-tree vlan priority
- spanning-tree vlan priority (Interface)
- spanning-tree vlan root
- Rapid Spanning-Tree Protocol
- Multiple Spanning-Tree
- Configure MSTP
- Create instances
- Root selection
- Non-Dell EMC hardware
- Region name or revision
- Modify parameters
- Interface parameters
- MST commands
- instance
- name
- revision
- spanning-tree mst
- spanning-tree msti
- spanning-tree mst configuration
- spanning-tree mst disable
- spanning-tree mst force-version
- spanning-tree mst forward-time
- spanning-tree mst hello-time
- spanning-tree mst mac-flush-threshold
- spanning-tree mst max-age
- spanning-tree mst max-hops
- show spanning-tree mst
- show spanning-tree msti
- Virtual LANs
- Port monitoring
- Layer 3
- Virtual routing and forwarding
- Configure management VRF
- Configure non-default VRF instances
- VRF configuration
- View VRF instance information
- Static route leaking
- VRF commands
- Bidirectional Forwarding Detection
- BFD session states
- BFD three-way handshake
- BFD configuration
- Configure BFD globally
- BFD for BGP
- BFD for OSPF
- BFD for Static routes
- Enable BFD for all static routes
- Establishing BFD Sessions for IPv4 Static Routes
- Establishing BFD Sessions for IPv4 Static Routes in a non-default VRF instance
- Changing IPv4 static route session parameters
- Disabling BFD for IPv4 Static Routes
- Establishing BFD Sessions for IPv6 Static Routes
- Establishing BFD Sessions for IPv6 Static Routes in a non-default VRF instance
- Changing IPv6 static route session parameters
- Disabling BFD for IPv6 Static Routes
- BFD commands
- Border Gateway Protocol
- Sessions and peers
- Route reflectors
- Multiprotocol BGP
- Attributes
- Selection criteria
- Weight and local preference
- Multiexit discriminators
- Origin
- AS path and next-hop
- Best path selection
- More path support
- Advertise cost
- 4-Byte AS numbers
- AS number migration
- Graceful restart
- Configure Border Gateway Protocol
- Enable BGP
- Disable announcements of ASN values
- Configure Dual Stack
- Configure administrative distance
- Peer templates
- Neighbor fall-over
- Configure password
- Fast external fallover
- Passive peering
- Local AS
- AS number limit
- Redistribute routes
- Additional paths
- MED attributes
- Local preference attribute
- Weight attribute
- Enable multipath
- Route-map filters
- Route reflector clusters
- Aggregate routes
- Confederations
- Route dampening
- Timers
- Neighbor soft-reconfiguration
- Redistribute iBGP route to OSPF
- Debug BGP
- BGP commands
- activate
- add-path
- address-family
- advertisement-interval
- advertisement-start
- aggregate-address
- allowas-in
- always-compare-med
- as-notation
- bestpath as-path
- bestpath med
- bestpath router-id
- clear ip bgp
- clear ip bgp *
- clear ip bgp dampening
- clear ip bgp flap-statistics
- connection-retry-timer
- confederation
- client-to-client
- cluster-id
- bgp dampening
- debug ip bgp
- description
- default-metric
- default-originate
- distance bgp
- distribute-list
- bgp default local-preference
- ebgp-multihop
- enforce-first-as
- fall-over
- fast-external-fallover
- graceful-restart
- inherit template
- listen
- local-as
- log-neighbor-changes
- maximum-paths
- maximum-prefix
- neighbor
- next-hop-self
- non-deterministic-med
- outbound-optimization
- password
- redistribute
- remote-as
- remove-private-as
- route-map
- route-reflector-client
- router bgp
- router-id
- send-community
- sender-side-loop-detection
- show ip bgp
- show ip bgp dampened-paths
- show ip bgp flap-statistics
- show ip bgp ipv4 unicast
- show ip bgp ipv6 unicast
- show ip bgp neighbors
- show ip bgp peer-group
- show ip bgp summary
- show ip route
- show ipv6 route
- soft-reconfiguration inbound
- template
- timers
- vrf
- weight
- Equal cost multi-path
- IPv4 routing
- IPv6 routing
- Enable or disable IPv6
- IPv6 addresses
- Stateless autoconfiguration
- Neighbor Discovery
- Duplicate address discovery
- Static IPv6 routing
- IPv6 destination unreachable
- IPv6 hop-by-hop options
- View IPv6 information
- IPv6 commands
- clear ipv6 neighbors
- clear ipv6 route
- ipv6 address
- ipv6 address autoconfig
- ipv6 address dhcp
- ipv6 enable
- ipv6 address eui-64
- ipv6 address link-local
- ipv6 hop-by-hop
- ipv6 nd dad
- ipv6 nd hop-limit
- ipv6 nd managed-config-flag
- ipv6 nd max-ra-interval
- ipv6 nd mtu
- ipv6 nd other-config-flag
- ipv6 nd prefix
- ipv6 nd ra-lifetime
- ipv6 nd reachable-time
- ipv6 nd retrans-timer
- ipv6 nd send-ra
- ipv6 route
- ipv6 unreachables
- show ipv6 neighbors
- show ipv6 route
- show ipv6 interface brief
- Open shortest path first
- Autonomous system areas
- Areas, networks, and neighbors
- Router types
- Designated and backup designated routers
- Link-state advertisements
- Router priority
- Shortest path first throttling
- OSPFv2
- Enable OSPFv2
- Enable OSPFv2 in a non-default VRF instance
- Assign router identifier
- Stub areas
- Passive interfaces
- Fast convergence
- Interface parameters
- Redistribute routes
- Default route
- Summary address
- Graceful restart
- OSPFv2 authentication
- Troubleshoot OSPFv2
- Debug OSPF
- OSPFv2 commands
- area default-cost
- area nssa
- area range
- area stub
- auto-cost reference-bandwidth
- clear ip ospf process
- clear ip ospf statistics
- debug ip ospfv2
- default-information originate
- default-metric
- fast-converge
- graceful-restart
- ip ospf area
- ip ospf authentication-key
- ip ospf cost
- ip ospf dead-interval
- ip ospf hello-interval
- ip ospf message-digest-key
- ip ospf mtu-ignore
- ip ospf network
- ip ospf passive
- ip ospf priority
- ip ospf retransmit-interval
- ip ospf transmit-delay
- log-adjacency-changes
- max-metric router-lsa
- maximum-paths
- redistribute
- router-id
- router ospf
- show ip ospf
- show ip ospf asbr
- show ip ospf database
- show ip ospf database asbr-summary
- show ip ospf database external
- show ip ospf database network
- show ip ospf database nssa external
- show ip ospf database opaque-area
- show ip ospf database opaque-as
- show ip ospf database opaque-link
- show ip ospf database router
- show ip ospf database summary
- show ip ospf interface
- show ip ospf routes
- show ip ospf statistics
- show ip ospf topology
- summary-address
- timers lsa arrival
- timers spf
- timers throttle lsa all
- OSPFv3
- Enable OSPFv3
- Enable OSPFv3 in a non-default VRF instance
- Assign Router ID
- Configure Stub Areas
- Enable Passive Interfaces
- Interface OSPFv3 Parameters
- Default route
- OSPFv3 IPsec authentication and encryption
- Troubleshoot OSPFv3
- OSPFv3 Commands
- area authentication
- area encryption
- area stub
- auto-cost reference-bandwidth
- clear ipv6 ospf process
- clear ipv6 ospf statistics
- debug ip ospfv3
- default-information originate
- ipv6 ospf area
- ipv6 ospf authentication
- ipv6 ospf cost
- ipv6 ospf dead-interval
- ipv6 ospf encryption
- ipv6 ospf hello-interval
- ipv6 ospf network
- ipv6 ospf passive
- ipv6 ospf priority
- log-adjacency-changes
- maximum-paths
- redistribute
- router-id
- router ospfv3
- show ipv6 ospf
- show ipv6 ospf database
- show ipv6 ospf interface
- show ipv6 ospf neighbor
- show ipv6 ospf statistics
- timers spf (OSPFv3)
- Object tracking manager
- Policy-based routing
- Virtual Router Redundancy Protocol
- Virtual routing and forwarding
- Multicast
- Important notes
- Configure multicast routing
- Unknown multicast flood control
- Multicast Commands
- Internet Group Management Protocol
- Standards compliance
- Important notes
- Supported IGMP versions
- Query interval
- Last member query interval
- Maximum response time
- IGMP immediate leave
- Select an IGMP version
- View IGMP-enabled interfaces and groups
- IGMP snooping
- IGMP commands
- clear ip igmp groups
- ip igmp immediate-leave
- ip igmp last-member-query-interval
- ip igmp query-interval
- ip igmp query-max-resp-time
- ip igmp snooping enable
- ip igmp snooping
- ip igmp snooping fast-leave
- ip igmp snooping last-member-query-interval
- ip igmp snooping mrouter
- ip igmp snooping querier
- ip igmp snooping query-interval
- ip igmp snooping query-max-resp-time
- ip igmp version
- show ip igmp groups
- show ip igmp interface
- show ip igmp snooping groups
- show ip igmp snooping interface
- show ip igmp snooping mrouter
- Multicast Listener Discovery Protocol
- MLD snooping
- MLD snooping commands
- ipv6 mld snooping
- ipv6 mld snooping enable
- ipv6 mld snooping fast-leave
- ipv6 mld snooping last-member-query-interval
- ipv6 mld snooping mrouter
- ipv6 mld snooping querier
- ipv6 mld snooping query-interval
- ipv6 mld query-max-resp-time
- ipv6 mld version
- show ipv6 mld snooping groups
- show ipv6 mld snooping groups detail
- show ipv6 mld snooping interface
- show ipv6 mld snooping mrouter
- Protocol Independent Multicast
- PIM terminology
- Standards compliance
- PIM-SM
- PIM-SSM
- Configure expiry timers for S, G entries
- Configure static rendezvous point
- Configure dynamic RP using the BSR mechanism
- Configure designated router priority
- PIM commands
- clear ip pim tib
- ip multicast-routing
- ip pim bsr-candidate
- ip pim bsr-candidate-timers
- ip pim bsr-timeout
- ip pim dr-priority
- ip pim query-interval
- ip pim rp-address
- ip pim rp-candidate
- ip pim rp-candidate-timers
- ip pim sparse-mode
- ip pim sparse-mode sg-expiry-timer
- ip pim ssm-range
- show ip pim bsr-router
- show ip pim interface
- show ip pim mcache
- show ip pim neighbor
- show ip pim rp
- show ip pim ssm-range
- show ip pim summary
- show ip pim tib
- show ip rpf
- PIM-SM sample configuration
- PIM-SSM sample configuration
- Multicast VRF sample configuration
- VLT multicast routing
- VXLAN
- VXLAN concepts
- VXLAN as NVO solution
- Configure VXLAN
- L3 VXLAN route scaling
- DHCP relay on VTEPs
- View VXLAN configuration
- VXLAN MAC addresses
- VXLAN commands
- hardware overlay-routing-profile
- interface virtual-network
- ip virtual-router address
- ip virtual-router mac-address
- member-interface
- nve
- remote-vtep
- show hardware overlay-routing-profile mode
- show interface virtual-network
- show nve remote-vtep
- show nve remote-vtep counters
- show nve vxlan-vni
- show virtual-network
- show virtual-network counters
- show virtual-network interface counters
- show virtual-network interface
- show virtual-network vlan
- show vlan (virtual network)
- source-interface loopback
- virtual-network
- virtual-network untagged-vlan
- vxlan-vni
- VXLAN MAC commands
- clear mac address-table dynamic nve remote-vtep
- clear mac address-table dynamic virtual-network
- show mac address-table count extended
- show mac address-table count nve
- show mac address-table count virtual-network
- show mac address-table extended
- show mac address-table nve
- show mac address-table virtual-network
- Example: VXLAN with static VTEP
- BGP EVPN for VXLAN
- BGP EVPN compared to static VXLAN
- VXLAN BGP EVPN operation
- Configure BGP EVPN for VXLAN
- VXLAN BGP EVPN routing
- BGP EVPN with VLT
- VXLAN BGP commands
- VXLAN EVPN commands
- Example: VXLAN with BGP EVPN
- Example: VXLAN BGP EVPN — Multiple AS topology
- Example: VXLAN BGP EVPN — Centralized L3 gateway
- Example: VXLAN BGP EVPN — Border leaf gateway with asymmetric IRB
- Controller-provisioned VXLAN
- UFT modes
- Security
- AAA authentication
- User re-authentication
- Password strength
- Simple password check
- Obscure passwords
- Role-based access control
- Assign user role
- Bootloader protection
- Linuxadmin user configuration
- AAA authentication
- RADIUS authentication
- RADIUS over TLS authentication
- TACACS+ authentication
- Unknown user role
- SSH server
- Virtual terminal line ACLs
- Restrict SNMP access
- Enable AAA accounting
- Enable user lockout
- Limit concurrent login sessions
- Enable login statistics
- Privilege levels
- Audit log
- Security commands
- aaa accounting
- aaa authentication login
- aaa re-authenticate enable
- boot protect disable username
- boot protect enable username password
- clear logging audit
- crypto ssh-key generate
- disable
- enable
- enable password priv-lvl
- ip access-class
- ip radius source-interface
- ip tacacs source-interface
- ipv6 access-class
- ip ssh server challenge-response-authentication
- ip ssh server cipher
- ip ssh server enable
- ip ssh server hostbased-authentication
- ip ssh server kex
- ip ssh server mac
- ip ssh server password-authentication
- ip ssh server port
- ip ssh server pubkey-authentication
- ip ssh server vrf
- line vty
- logging audit enable
- login concurrent-session limit
- login-statistics enable
- mac address-table static
- password-attributes
- password-attributes max-retry lockout-period
- privilege
- radius-server host
- radius-server host tls
- radius-server retransmit
- radius-server timeout
- radius-server vrf
- service obscure-password
- service simple-password
- show boot protect
- show crypto ssh-key
- show ip ssh
- show mac address-table count
- show logging audit
- show login-statistics
- show privilege
- show running-configuration privilege
- show users
- system-user linuxadmin disable
- system-user linuxadmin password
- tacacs-server host
- tacacs-server timeout
- tacacs-server vrf
- username password role
- username sshkey
- username sshkey filename
- userrole inherit
- X.509v3 certificates
- X.509v3 concepts
- Public key infrastructure
- Manage CA certificates
- Certificate revocation
- Request and install host certificates
- Self-signed certificates
- Security profiles
- Cluster security
- X.509v3 commands
- certificate
- cluster security-profile
- crypto ca-cert delete
- crypto ca-cert install
- crypto cdp add
- crypto cdp delete
- crypto cert delete
- crypto cert generate
- crypto cert install
- crypto crl delete
- crypto crl install
- crypto fips enable
- crypto security-profile
- peer-name-check
- revocation-check
- show crypto ca-certs
- show crypto cdp
- show crypto cert
- show crypto crl
- Example: Configure RADIUS over TLS with X.509v3 certificates
- OpenFlow
- OpenFlow logical switch instance
- OpenFlow controller
- OpenFlow version 1.3
- Ports
- Flow table
- Group table
- Meter table
- Instructions
- Action set
- Action types
- Counters
- OpenFlow protocol
- Connection setup TCP
- Supported controllers
- Flow table modification messages
- Message types
- Flow match fields
- Action structures
- Capabilities supported by the data path
- Multipart message types
- Switch description
- Property type
- Group configuration
- Controller roles
- Packet-in reasons
- Flow-removed reasons
- Error types from switch to controller
- OpenFlow use cases
- Configure OpenFlow
- OpenFlow commands
- OpenFlow-only mode commands
- Access Control Lists
- IP ACLs
- MAC ACLs
- Control-plane ACLs
- IP fragment handling
- L3 ACL rules
- Assign sequence number to filter
- Delete ACL rule
- L2 and L3 ACLs
- Assign and apply ACL filters
- Ingress ACL filters
- Egress ACL filters
- VTY ACLs
- SNMP ACLs
- Clear access-list counters
- IP prefix-lists
- Route-maps
- Match routes
- Set conditions
- Continue clause
- ACL flow-based monitoring
- Enable flow-based monitoring
- View ACL table utilization report
- ACL logging
- ACL commands
- clear ip access-list counters
- clear ipv6 access-list counters
- clear mac access-list counters
- deny
- deny (IPv6)
- deny (MAC)
- deny icmp
- deny icmp (IPv6)
- deny ip
- deny ipv6
- deny tcp
- deny tcp (IPv6)
- deny udp
- deny udp (IPv6)
- description
- ip access-group
- ip access-list
- ip as-path access-list
- ip community-list standard deny
- ip community–list standard permit
- ip extcommunity-list standard deny
- ip extcommunity-list standard permit
- ip prefix-list description
- ip prefix-list deny
- ip prefix-list permit
- ip prefix-list seq deny
- ip prefix-list seq permit
- ipv6 access-group
- ipv6 access-list
- ipv6 prefix-list deny
- ipv6 prefix-list description
- ipv6 prefix-list permit
- ipv6 prefix-list seq deny
- ipv6 prefix-list seq permit
- mac access-group
- mac access-list
- permit
- permit (IPv6)
- permit (MAC)
- permit icmp
- permit icmp (IPv6)
- permit ip
- permit ipv6
- permit tcp
- permit tcp (IPv6)
- permit udp
- permit udp (IPv6)
- remark
- seq deny
- seq deny (IPv6)
- seq deny (MAC)
- seq deny icmp
- seq deny icmp (IPv6)
- seq deny ip
- seq deny ipv6
- seq deny tcp
- seq deny tcp (IPv6)
- seq deny udp
- seq deny udp (IPv6)
- seq permit
- seq permit (IPv6)
- seq permit (MAC)
- seq permit icmp
- seq permit icmp (IPv6)
- seq permit ip
- seq permit ipv6
- seq permit tcp
- seq permit tcp (IPv6)
- seq permit udp
- seq permit udp (IPv6)
- show access-group
- show access-lists
- show acl-table-usage detail
- show ip as-path-access-list
- show ip community-list
- show ip extcommunity-list
- show ip prefix-list
- show logging access-list
- Route-map commands
- continue
- match as-path
- match community
- match extcommunity
- match interface
- match ip address
- match ip next-hop
- match ipv6 address
- match ipv6 next-hop
- match metric
- match origin
- match route-type
- match tag
- route-map
- set comm-list add
- set comm-list delete
- set community
- set extcomm-list add
- set extcomm-list delete
- set extcommunity
- set local-preference
- set metric
- set metric-type
- set next-hop
- set origin
- set tag
- set weight
- show route-map
- Quality of service
- Configure quality of service
- Ingress traffic classification
- Egress traffic classification
- Policing traffic
- Mark Traffic
- Color traffic
- Modify packet fields
- Shaping traffic
- Bandwidth allocation
- Strict priority queuing
- Rate adjustment
- Buffer management
- Congestion avoidance
- Storm control
- RoCE for faster access and lossless connectivity
- Port to port-pipe and MMU mapping
- QoS commands
- bandwidth
- buffer-statistics-tracking
- class
- class-map
- clear qos statistics
- clear qos statistics type
- control-plane
- control-plane-buffer-size
- flowcontrol
- hardware deep-buffer-mode
- match
- match cos
- match dscp
- match precedence
- match queue
- match vlan
- mtu
- pause
- pfc-cos
- pfc-max-buffer-size
- pfc-shared-buffer-size
- pfc-shared-headroom-buffer-size
- police
- policy-map
- priority
- priority-flow-control mode
- qos-group dot1p
- qos-group dscp
- qos-map traffic-class
- qos-rate-adjust
- queue-limit
- queue bandwidth
- queue qos-group
- queue qos-group (Z9332F-ON)
- random-detect (interface)
- random-detect (queue)
- random-detect color
- random-detect ecn
- random-detect ecn
- random-detect pool
- random-detect weight
- service-policy
- set cos
- set dscp
- set qos-group
- shape
- show class-map
- show control-plane buffers
- show control-plane buffer-stats
- show control-plane info
- show control-plane statistics
- show hardware deep-buffer-mode
- show interface priority-flow-control
- show qos interface
- show policy-map
- show qos control-plane
- show qos egress buffers interface
- show qos egress buffer-statistics-tracking
- show qos egress buffer-stats interface
- show qos headroom-pool buffer-statistics-tracking
- show qos ingress buffers interface
- show qos ingress buffer-statistics-tracking
- show qos ingress buffer-stats interface
- show qos maps
- show qos maps (Z9332F-ON)
- show qos port-map details
- show qos-rate-adjust
- show qos service-pool buffer-statistics-tracking
- show qos system
- show qos system buffers
- show qos wred-profile
- show queuing statistics
- system qos
- trust dot1p-map
- trust dscp-map
- trust-map
- wred
- Virtual Link Trunking
- Terminology
- VLT domain
- VLT interconnect
- Graceful LACP with VLT
- Configure VLT
- Configure VRRP Active-Active mode
- Migrate VMs across data centers with eVLT
- View VLT information
- VLT commands
- backup destination
- delay-restore
- discovery-interface
- peer-routing
- peer-routing-timeout
- primary-priority
- show running-configuration vlt
- show spanning-tree virtual-interface
- show vlt
- show vlt backup-link
- show vlt mac-inconsistency
- show vlt mismatch
- show vlt role
- show vlt vlt-port-detail
- vlt-domain
- vlt-port-channel
- vlt-mac
- vrrp mode active-active
- Uplink Failure Detection
- Converged data center services
- sFlow
- Telemetry
- RESTCONF API
- Troubleshoot OS10
- Diagnostic tools
- Recover Linux password
- Recover OS10 user name password
- Restore factory defaults
- SupportAssist
- Important notes
- Configure SupportAssist
- Set company name
- Set contact information
- Schedule activity
- View status
- List of country names and codes
- SupportAssist commands
- Support bundle
- System monitoring
- Log into OS10 device
- Frequently asked questions
- Support resources

profile1 | 10 100 100 | | | | Off|
-------------|-----------------------|---------------------|--------------------|--------|-----|
profile2 | | | | | On|
|-----------------------|---------------------|--------------------|--------|-----|
Color Blind ECN Thd| 100 1000 100 |
-------------|-----------------------|---------------------|--------------------|--------|-----|
Supported
Releases
show queuing statistics
Displays QoS queuing statistics information.
Syntax
show queuing statistics interface ethernet node/slot/port[:subport] [wred |
queue number]
Parameters
• node/slot/port[:subport] — Enter the Ethernet interface information.
• queue number — Enter the QoS queue number, from 0 to 7.
Default Not configured
Command Mode EXEC
Usage Information Use this command to view all queuing counters. WRED counters are available only at the port level.
Example
OS10# show queuing statistics interface ethernet 1/1/1
Interface ethernet1/1/1
Queue Packets Bytes Dropped-
Packets Dropped-Bytes
0 0 0
0 0
1 0 0
0 0
2 0 0
0 0
3 0 0
0 0
4 0 0
0 0
5 0 0
0 0
6 0 0
0 0
7 0 0
0 0
Example (wred)
OS10# show queuing statistics interface ethernet 1/1/1 wred
Interface ethernet1/1/1 (All queues)
Description Packets Bytes
Output 0 0
Dropped 0 0
Green Drop 0 0
Yellow Drop 0 0
Red Drop 0 0
ECN marked count 0 0
Example (queue)
OS10# show queuing statistics interface ethernet 1/1/1 queue 3
Interface ethernet1/1/1
Queue Packets Bytes Dropped-
Packets Dropped-Bytes
3 0 0
0 0
Quality of service 1167