
Quick Start Manual


13
4
Right-click then click
Assign User
to select a user owner for the alarm.
5
Right-click then click
Clear Alarm
to remove the alarm from list.
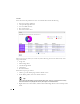
6
Click the plus (+) in the upper right corner of the Alarms portlet to go into Expanded mode
where you can view more details about an alarm.
Performance Management - Troubleshooting
In addition to troubleshooting faults, you can also monitor device performance with Dell
OpenManage Network Manager.
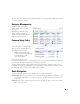
Monitors
Monitors display some critical performance
metrics for devices on the network,
including:
•Network availability
•Bandwidth capacity utilization
•Buffer usage and errors
•CPU and memory utilization
•Interface errors and discards
•Network latency
•Node and interface status
To get started using monitors, follow these
steps:
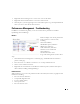
1
Click the Performance Management > Summary page, and find the Resource Monitors
portlet on that page.
2
Hover the cursor over a Monitor of interest to see a tooltip of details about it.
3
Click to select a Monitor of interest.
4
Right-click the selected monitor in the Resource Monitors portlet, and then click
Open
to
edit its details, including enabling/disabling it.
Dashboard Views
With permissions, you can view the performance data collected by the monitors, in graphical and
tabular form including:
• Excessive interface utilization
• Unexpectedly high CPU load
• Loss of available memory
• Slow response time
• Excessive interface errors