
Users Guide


To access the Client Diagram:
1 In the OpsMgr console, click Monitoring.
2 In the Monitoring pane, go to the Dell folder and click the folder to display the dierent views.
3
Click Diagram Views > Client Diagram.
The Client Diagram oers a graphical representation of all Dell client systems that OpsMgr manages. You can expand and verify the
status of individual systems and their components in the diagram. The root node for this view is the Dell Windows Clients group. You
can view details for Dell Clients with this view.
4 Select a component in the diagram to view the details in the Detail View pane. You can view details of the Dell Command | Monitor or
OMCI service and the following hardware components of Dell clients:
• Memory
• Processors
• Sensors
• Storage
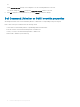
Complete diagram view
Figure 2. Graphical representation of all dell devices
To access the Complete Diagram View:
1 In the OpsMgr console, click Monitoring.
2 In the Monitoring pane on the left side, navigate to the Dell folder and click the folder to display the dierent views.
3 Click Diagram Views > Complete Diagram View.
The Complete Diagram View oers a graphical representation of all Dell devices that OpsMgr manages. You can expand and verify the
status of individual devices and their components in the diagram. You can view details for Dell Clients and Dell UnManaged with the
Complete Diagram View.
4 Select a component in the diagram to view the details in the Detail View pane.
Viewing Dell client hardware health roll-up
You can view the Dell client hardware health rolled up to Windows computer health.
Dell Client Management Pack operations
11