
Users Guide

The OpsMgr console displays the alerts for all the Dell client systems that you are monitoring in the
Client Alerts pane. You can see alerts that meet the criteria that you specified in the Authoring pane
of the OpsMgr console, such as severity, resolution state, or alerts that are assigned to you.
4. Select an alert to view the details in the Alert Details pane.
Diagram views
The Diagram Views displays a hierarchical and graphical representation of all Dell clients on your network
that OpsMgr manages. The Dell Windows Client Management Pack offers the following views:
• Client Diagram
• Complete Diagram View
Client diagram view
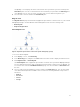
Figure 1. Graphical representation of dell client systems managed by opsmgr
To access the Client Diagram:
1. In the OpsMgr console, click Monitoring.
2. In the Monitoring pane, navigate to the Dell folder and click the folder to display the different views.
3. Click Diagram Views → Client Diagram.
The Client Diagram offers a graphical representation of all Dell client systems that OpsMgr manages.
You can expand and verify the status of individual systems and their components in the diagram. The
root node for this view is the Dell Windows Clients group. You can view details for Dell Clients with
this view.
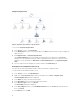
4. Select a component in the diagram to view the details in the Detail View pane. You can view details
of the Dell Command | Monitor or OMCI service as well as the following hardware components of
Dell clients:
• Memory
• Processors
• Sensors
• Storage
11