
Users Guide


Health Status Indicators
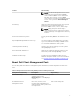
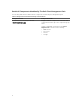
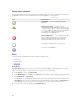
The following table lists the icons that indicate the health status of the discovered Dell client systems on
the OpsMgr console. For more information on severity propagation, see State Views.
Icon Severity Level
Normal/OK — The component is working as
expected.
Warning/Noncritical — A probe or other
monitoring device has detected a reading for the
component that is above or below the acceptable
level. The component may still be functioning, but
it could fail. The component may also be
functioning in an impaired state.
Critical/Failure/Error — The component has either
failed or failure is imminent. The component
requires immediate attention and may need
replacement. Data loss may have occurred.
The specific component is not monitored.
The service is unavailable.
Views
You can monitor the Dell Client systems using the following views:
• Alerts Views
• Diagram Views
• State Views
Alerts Views
The Alerts Views displays alerts for the events received from the OMCI service running on the systems
that you are monitoring. To view the alerts for the systems you are monitoring:
1. In the OpsMgr console, click Monitoring.
2. In the Monitoring pane, navigate to the Dell folder and click the folder to display the different views.
3. Click Alerts Views → Client Alerts.
The OpsMgr console displays the alerts for all the Dell client systems that you are monitoring in the
Client Alerts pane. You can see alerts that meet the criteria that you specified in the Authoring pane
of the OpsMgr console, such as severity, resolution state, or alerts that are assigned to you.
4. Select an alert to view the details in the Alert Details pane.
10