
Users Guide
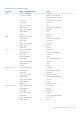

Component LED Color, Blinking Pattern Status
Blue, dark No fault
Fan Green, glowing steadily Fan working
Green, blinking Not used
Green, dark Powered off
Amber, glowing steadily Fan type not recognized, update CMC firmware
Amber, blinking Fan fault; tachometer out of range
Amber, dark Not used
PSU (Oval) Green, glowing steadily AC OK
(Oval) Green, blinking Not used
(Oval) Green, dark AC Not OK
Amber, glowing steadily Not used
Amber, blinking Fault
Amber, dark No fault
(Circle) Green, glowing steadily DC OK
(Circle) Green, dark DC Not OK
Troubleshooting Non-responsive CMC
If you cannot log in to CMC using any of the interfaces (the Web interface, Telnet, SSH, remote RACADM, or serial), you can verify the
CMC functionality observing the LEDs on CMC.
NOTE: It is not possible to log in to the standby CMC using a serial console.
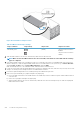
Observing LEDs to Isolate the Problem
Facing the front of CMC as it is installed in the chassis, there are two LEDs on the left side of the card:
• Top LED — The top green LED indicates power. If it is not on:
• Verify that you have AC present to at least one power supply.
• Verify that the CMC card is seated properly. You can release or pull the ejector handle, remove the CMC, reinstall the CMC making
sure that the board is inserted all the way and the latch closes correctly.
• Bottom LED — The bottom LED is multi-colored. When CMC is active and running, and there are no problems, the bottom LED is
blue. If it is amber, a fault is detected. The fault may be caused by any of the following three events:
• A core failure. In this case, the CMC board must be replaced.
• A self-test failure. In this case, the CMC board must be replaced.
• An image corruption. In this case, upload the CMC firmware image to recover the CMC.
NOTE:
A normal CMC boot or reset takes over a minute to fully boot into its operating system and be available for
login. The blue LED is enabled on the active CMC. In a redundant, two-CMC configuration, only the top green LED is
enabled on the standby CMC.
Troubleshooting Network Problems
The internal CMC trace log allows you to debug CMC alerts and networking. You can access the trace log using the CMC Web interface
or RACADM. See the gettracelog command section in the Chassis Management Controller for Dell PowerEdge M1000e RACADM
Command Line Reference Guide.
The trace log tracks the following information:
• DHCP — Traces packets sent to and received from a DHCP server.
• DDNS — Traces dynamic DNS update requests and responses.
218
Troubleshooting and Recovery