
Users Guide

Icon Description
Server is reporting a critical error.
No server is present.
NOTE: By default, the server state icons for Dell's 13th generation PowerEdge systems are displayed if, you insert a 14th
generation PowerEdge server when the chassis is turned o.
Selected Component Information
Information for the selected component is displayed in three independent sections:
• Health and Performance and Properties — Displays the active critical and non-critical events as shown by the hardware logs and the
performance data that vary with time.
• Properties — Displays the component properties that do not vary with time or change only infrequently.
• Quick Links — Provides links to navigate to the most frequently accessed pages, and also the most frequently performed actions. Only
links applicable to the selected component are displayed in this section.
NOTE
: In Multi-Chassis Management (MCM), all the Quick Links associated with the servers are not displayed.
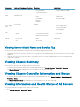
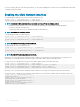
Table 16. Chassis Health page — component properties
Component Heath and Performance Properties Properties Quick Links
LCD Assembly
• LCD Health
• Chassis Health
None None
Active and
Standby CMCs
• Redundancy Mode
• MAC Address
• IPv4
• IPv6
• Firmware
• Standby Firmware
• Last Update
• Hardware
• CMC Status
• Networking
• Firmware Update
All Servers and
Individual
Servers
• Power State
• Power Consumtion
• Health
• Power Allocated
• Temperature
• Name
• Model
• Service Tag
• Host Name
• iDRAC
• CPLD
• BIOS
• OS
• Server Status
• Launch Remote Console
• Launch iDRAC GUI
• Launch OMSA GUI
• Power O Server
• Remote File Share
• Deploy iDRAC Network
Viewing Chassis Information and Monitoring Chassis and Component Health 73