
Users Guide
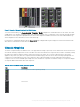
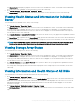
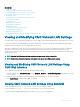
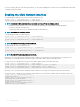

Figure 6. Example of Chassis Graphics in the Web Interface
To view the chassis health, go to Chassis Overview > Properties > Health. It displays the overall health status for the chassis, active and
standby CMCs, sever modules, IO Modules (IOMs), fans, iKVM, power supplies (PSUs), temperature sensors, and LCD assembly. Detailed
information for each component is displayed when you click on that component. In addition, the latest events in the CMC Hardware Log
are also displayed. For more information, see the CMC Online Help.
If your chassis is congured as a Group Lead, the Group Health page is displayed after login. It displays the chassis level information and
alerts. All active critical and non-critical alerts are displayed.
Chassis Graphics
The chassis is represented by front and back views—the upper and lower images, respectively. Servers and the LCD are shown in the front
view and the remaining components are shown in the back view. A blue cast indicates the component selection and is controlled by clicking
the image of the required component. When a component is present in the chassis, an icon of that component type is shown in the
graphics in the position (slot) where the component has been installed. Empty positions are shown with a charcoal gray background. The
component icon visually indicates the state of the component. Other components display icons that visually represent the physical
component. Icons for servers and IOMs span multiple slots when a double size component is installed. Hovering over a component displays
a tooltip with additional information about that component.
Table 14. Server Icon States in 13th generation systems
Icon Description
Server is powered on and is operating normally.
Server is o.
Viewing Chassis Information and Monitoring Chassis and Component Health 71