
Users Guide

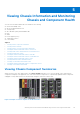
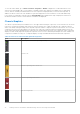
Table Of Contents
- Dell Chassis Management Controller Version 6.10 for PowerEdge M1000e User’s Guide
- Overview
- What is new in this release
- Key Features
- Chassis Overview
- CMC Port Information
- Minimum CMC Version
- Latest Firmware Versions for This Release
- Supported Remote Access Connections
- Supported platforms
- Supported Management Station Web Browsers
- Viewing Localized Versions of the CMC Web Interface
- Supported Management Console Applications
- Other Documents You May Need
- Contacting Dell
- Social Media Reference
- Installing and Setting Up CMC
- Before You Begin
- Installing CMC Hardware
- Installing Remote Access Software on a Management Station
- Configuring Web Browser
- Setting Up Initial Access to CMC
- Interfaces and Protocols to Access CMC
- Downloading and Updating CMC Firmware
- Setting Chassis Physical Location and Chassis Name
- Setting Date and Time on CMC
- Configuring LEDs to Identify Components on the Chassis
- Configuring CMC Properties
- Understanding Redundant CMC Environment
- Logging In to CMC
- Accessing CMC Web Interface
- Logging Into CMC as Local User, Active Directory User, or LDAP User
- Logging Into CMC Using Smart Card
- Logging Into CMC Using Single Sign-on
- Logging In to CMC Using Serial, Telnet, or SSH Console
- Accessing CMC Using RACADM
- Logging in to CMC Using Public Key Authentication
- Multiple CMC Sessions
- Changing Default Login Password
- Enabling or Disabling Default Password Warning Message
- Updating Firmware
- Downloading CMC Firmware
- Signed CMC Firmware Image
- Viewing Currently Installed Firmware Versions
- Updating CMC Firmware
- Updating iKVM Firmware
- Updating IOM Infrastructure Device Firmware
- Updating Server iDRAC Firmware Using Web Interface
- Updating Server iDRAC Firmware Using RACADM
- Updating Server Component Firmware
- Server Component Update Sequence
- Supported Firmware Versions for Server Component Update
- Enabling Lifecycle Controller
- Choosing Server Component Firmware Update Type Using CMC Web Interface
- Upgrading Server Component Firmware
- Filtering Components for Firmware Updates
- Viewing Firmware Inventory
- Saving Chassis Inventory Report Using CMC Web Interface
- Configuring Network Share Using CMC Web Interface
- Lifecycle Controller Job Operations
- Recovering iDRAC Firmware Using CMC
- Viewing Chassis Information and Monitoring Chassis and Component Health
- Viewing Chassis Component Summaries
- Viewing Chassis Summary
- Viewing Chassis Controller Information and Status
- Viewing Information and Health Status of All Servers
- Viewing Health Status and Information for Individual Server
- Viewing Storage Array Status
- Viewing Information and Health Status of All IOMs
- Viewing Information and Health Status For Individual IOM
- Viewing Information and Health Status of Fans
- Viewing iKVM Information and Health Status
- Viewing PSU Information and Health Status
- Viewing Information and Health Status of Temperature Sensors
- Viewing LCD Information and Health
- Configuring CMC
- Viewing and Modifying CMC Network LAN Settings
- Viewing and Modifying CMC Network LAN Settings Using CMC Web Interface
- Viewing CMC Network LAN Settings Using RACADM
- Enabling the CMC Network Interface
- Enabling or Disabling DHCP for the CMC Network Interface Address
- Enabling or Disabling DHCP for DNS IP Addresses
- Setting Static DNS IP addresses
- Configuring IPv4 and IPv6 DNS Settings
- Configuring Auto Negotiation, Duplex Mode, and Network Speed for IPv4 and IPv6
- Setting the Maximum Transmission Unit for IPv4 and IPv6
- Configuring CMC Network and Login Security Settings
- Configuring Virtual LAN Tag Properties for CMC
- Federal Information Processing Standards
- Configuring Services
- Configuring CMC Extended Storage Card
- Setting Up Chassis Group
- Adding Members to Chassis Group
- Removing a Member from the Leader
- Disbanding a Chassis Group
- Disabling an Individual Member at the Member Chassis
- Launching a Member Chassis’s or Server’s Web page
- Propagating Leader Chassis Properties to Member Chassis
- Server Inventory for Multi Chassis Management Group
- Saving Server Inventory Report
- Chassis Group Inventory and Firmware Version
- Viewing Chassis Group Inventory
- Viewing Selected Chassis Inventory Using Web Interface
- Viewing Selected Server Component Firmware Versions Using Web Interface
- Obtaining Certificates
- Chassis Configuration Profiles
- Saving Chassis Configuration
- Restoring Chassis Configuration Profile
- Viewing Stored Chassis Configuration Profiles
- Importing Chassis Configuration Profiles
- Applying Chassis Configuration Profiles
- Exporting Chassis Configuration Profiles
- Editing Chassis Configuration Profiles
- Deleting Chassis Configuration Profiles
- Configuring Multiple CMCs through RACADM Using Chassis Configuration Profiles
- Configuring Multiple CMCs through RACADM Using Configuration File
- Viewing and Terminating CMC Sessions
- Configuring Enhanced Cooling Mode for Fans
- Viewing and Modifying CMC Network LAN Settings
- Configuring Server
- Configuring Slot Names
- Configuring iDRAC Network Settings
- Configuring iDRAC VLAN Tag Settings
- Setting First Boot Device
- Configuring Server FlexAddress
- Configuring Remote File Share
- Configuring Profile Settings Using Server Configuration Replication
- Accessing Server Profiles Page
- Adding or Saving Profile
- Applying Profile
- Importing Profile
- Exporting Profile
- Editing Profile
- Deleting Profile
- Viewing Profile Settings
- Viewing Stored Profile Settings
- Viewing Profile Log
- Completion Status, Log View, and Troubleshooting
- Quick Deploy of Profiles
- Assigning Server Profiles to Slots
- Boot Identity Profiles
- Saving Boot Identity Profiles
- Applying Boot Identity Profiles
- Clearing Boot Identity Profiles
- Viewing Stored Boot Identity Profiles
- Importing Boot Identity Profiles
- Exporting Boot Identity Profiles
- Deleting Boot Identity Profiles
- Managing Virtual MAC Address Pool
- Creating MAC Pool
- Adding MAC Addresses
- Removing MAC Addresses
- Deactivating MAC Addresses
- Launching iDRAC using Single Sign-On
- Launching Remote Console from CMC Web Interface
- Configuring CMC To Send Alerts
- Configuring User Accounts and Privileges
- Types of Users
- Modifying Root User Administrator Account Settings
- Configuring Local Users
- Configuring Active Directory Users
- Supported Active Directory Authentication Mechanisms
- Standard Schema Active Directory Overview
- Configuring Standard Schema Active Directory
- Extended Schema Active Directory Overview
- Configuring Extended Schema Active Directory
- Configuring Generic LDAP Users
- Configuring CMC For Single Sign-On Or Smart Card Login
- Configuring CMC to Use Command Line Consoles
- Using FlexAddress and FlexAdress Plus Cards
- About Flexaddress
- About FlexAddress Plus
- FlexAddress and FlexAddress Plus Comparison
- Activating FlexAddress
- Activating FlexAddress Plus
- Verifying FlexAddress Activation
- Deactivating FlexAddress
- Configuring FlexAddress
- Viewing WWN or MAC Address Information
- Viewing Basic WWN or MAC Address Information Using Web Interface
- Viewing Advanced WWN or MAC Address Information Using Web Interface
- Viewing WWN or MAC Address Information Using RACADM
- Viewing World Wide Name or Media Access Control IDs
- Command Messages
- FlexAddress DELL SOFTWARE LICENSE AGREEMENT
- Managing Input Output Fabric
- Fabric Management Overview
- Invalid Configurations
- Fresh Power-up Scenario
- Monitoring IOM Health
- Viewing Input Output Module Uplink and Downlink Status Using Web Interface
- Viewing Input Output Module FCoE Session Information Using Web Interface
- Viewing Stacking Information for Dell PowerEdge M Input Output Aggregator
- Configuring Network Settings for IOMs
- Resetting IOM to Factory Default Settings
- Updating IOM Software Using CMC Web Interface
- IOA GUI
- Input Output Aggregator Module
- Managing VLAN for IOM
- Configuring Management VLAN on IOMs Using Web Interface
- Configuring Management VLAN on IOMs Using RACADM
- Configuring VLAN settings on IOMs Using CMC Web Interface
- Viewing the VLAN settings on IOMs Using CMC Web Interface
- Adding Tagged VLANs for IOMs Using CMC Web Interface
- Removing VLANs for IOMs Using CMC Web Interface
- Updating Untagged VLANs for IOMs Using CMC Web Interface
- Resetting VLANs for IOMs Using CMC Web Interface
- Managing Power Control Operation for IOMs
- Enabling or Disabling LED Blinking for IOMs
- Configuring and Using iKVM
- iKVM User Interface
- iKVM Key Features
- Physical Connection Interfaces
- Using OSCAR
- Managing Servers With iKVM
- Managing iKVM From CMC
- Managing and Monitoring Power
- Redundancy Policies
- Extended Power Performance
- Dynamic Power Supply Engagement
- Default Redundancy Configuration
- Power Budgeting For Hardware Modules
- Server Slot Power Priority Settings
- Viewing Power Consumption Status
- Viewing Power Budget Status
- Redundancy Status and Overall Power Health
- Configuring power budget and redundancy
- Power Conservation and Power Budget
- Maximum Power Conservation Mode
- Server Power Reduction to Maintain Power Budget
- 110V PSUs AC Operation
- Server Performance Over Power Redundancy
- Remote Logging
- External Power Management
- Configuring Power Budget and Redundancy Using CMC Web Interface
- Configuring Power Budget and Redundancy Using RACADM
- Executing Power Control Operations
- Troubleshooting and Recovery
- Gathering Configuration Information, Chassis Status, and Logs Using RACDUMP
- First Steps to Troubleshoot a Remote System
- Troubleshooting Alerts
- Viewing Event Logs
- Using Diagnostic Console
- Resetting Components
- Saving or Restoring Chassis Configuration
- Troubleshooting Network Time Protocol Errors
- Interpreting LED Colors and Blinking Patterns
- Troubleshooting Non-responsive CMC
- Troubleshooting Network Problems
- Resetting Administrator Password
- Using LCD Panel Interface
- Frequently Asked Questions
- Use Case Scenarios

To view the chassis health, go to Chassis Overview > Properties > Health. It displays the overall health status for the
chassis, active and standby CMCs, sever modules, IO Modules (IOMs), fans, iKVM, power supplies (PSUs), temperature
sensors, and LCD assembly. Detailed information for each component is displayed when you click on that component. In
addition, the latest events in the CMC Hardware Log are also displayed. For more information, see the CMC Online Help.
If your chassis is configured as a Group Lead, the Group Health page is displayed after login. It displays the chassis level
information and alerts. All active critical and non-critical alerts are displayed.
Chassis Graphics
The chassis is represented by front and back views—the upper and lower images, respectively. Servers and the LCD are shown
in the front view and the remaining components are shown in the back view. A blue cast indicates the component selection
and is controlled by clicking the image of the required component. When a component is present in the chassis, an icon of that
component type is shown in the graphics in the position (slot) where the component has been installed. Empty positions are
shown with a charcoal gray background. The component icon visually indicates the state of the component. Other components
display icons that visually represent the physical component. Icons for servers and IOMs span multiple slots when a double size
component is installed. Hovering over a component displays a tooltip with additional information about that component.
Table 14. Server Icon States in 13th generation systems
Icon Description
Server is powered on and is operating normally.
Server is off.
Server is reporting a non-critical error.
Server is reporting a critical error.
No server is present.
66 Viewing Chassis Information and Monitoring Chassis and Component Health