
CLI Guide
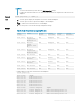
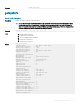

Overall Power Health = OK
Redundancy = No
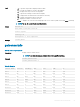
[System Power Policy Configuration]
System Input Power Cap =
7928 W (7928 BTU/hr |
10%)
Surplus for Peak Performance = 7000
W (6130 BTU/hr)
Redundancy Policy = None
Dynamic PSU Engagement Enabled = No
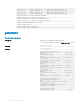
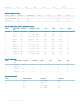
[Power Budgeting]
System Input Max Power
Capacity = 0 W
Input Redundancy
Reserve = 0 W
Input Power Allocated to
Servers = 0 W
Input Power Allocated to Chassis
Infrastructure = 51W
Total Input Power Available for Allocation = 0
W
Standby Input Power
Capacity = 0 W
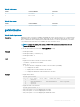
getraclog
Table 53. Details of getraclog
Description
The getraclog command displays RAC log entries.
Synopsis
racadm getraclog [-s <start>] [-c <count>]
Input
NOTE: If no options are provided, the entire log is displayed.
• -c — Species the number of records to display.
• -s — Species the starting record used for the display.
• --more — Displays one screen at a time and prompts the user to continue.
Output
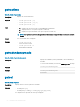
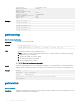
The default output display shows the record number, message ID, category, agent ID, severity, time stamp, message
arg, and message. The timestamp begins at midnight, January 1, and increases until the system restarts. After the
system restarts, the system’s timestamp is used.
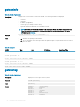
SeqNumber = 4
Message ID = CMC8550
Category = Audit
AgentID = CMC
Severity = Information
Timestamp = 1982-03-21 05:33:35
Message Arg 1 = Healthy
Message = Chassis health is Healthy
Example
• Displays all the logs.
racadm getraclog
• Displays 3 records from record number 5:
racadm getraclog -s 5 -c 3
RACADM Subcommand Details 53