
User's Manual


Using the CMC Web Interface 107
The Chassis Component Summary section (also entitled "Chassis Health"
when the overall chassis information is shown) displays the graphics and their
associated information. You can hide this entire section by clicking the Close
icon.
The left half of the Chassis Component Summary section displays the
graphics and Chassis Quick Links. The right half of this section displays
information, links, and actions related to the selected component. Click the
graphical representation of a component to select the component. The
graphic is cast in blue after selection.
The Recent CMC Hardware Log Events list displays the latest 10 events
from this log. The content of this section is dynamically updated and
presented with the latest event at the top of the list. For more information on
CMC Hardware Log entries, see "Viewing the Event Logs" on page 391.
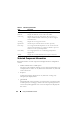
Chassis Component Summary
Chassis Graphics
The chassis is represented by front and back views (the upper and lower
images, respectively). Servers and the LCD are shown in the front view and
the remaining components are shown in the back view. Component selection
is indicated by a blue cast and is controlled by clicking the image of the
required component. When a component is present in the chassis, an icon of
that component type is shown in the graphics in the position (slot) where the
component has been installed. Empty positions are shown with a charcoal-
gray background. The component icon visually indicates the state of the
component. The server icon is used in Table 5-1 as an example. Other
components display icons that visually represent the physical component.
Icons for servers and IOMs span multiple slots when a double size component
is installed. Hovering over a component displays a tooltip with additional
information about that component.