
Users Guide
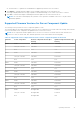

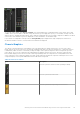
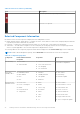

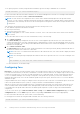
Table Of Contents
- Dell Chassis Management Controller Version 3.0 for Dell EMC PowerEdge VRTX User's Guide
- Contents
- Overview
- What is new in this release
- Key Features
- Chassis Overview
- Minimum CMC Version
- Supported Remote Access Connections
- Supported Platforms
- Supported Web Browsers
- Managing Licenses
- Viewing Localized Versions of the CMC Web Interface
- Supported Management Console Applications
- How to use this Guide
- Other Documents You May Need
- Accessing support content from the Dell EMC support site
- Installing and Setting Up CMC
- Before You Begin
- Installing CMC Hardware
- Installing Remote Access Software on a Management Station
- Configuring a Web Browser
- Setting Up Initial Access to CMC
- Interfaces and Protocols to Access CMC
- Downloading and Updating CMC Firmware
- Setting Chassis Physical Location and Chassis Name
- Setting Date and Time on CMC
- Configuring LEDs to Identify Components on the Chassis
- Configuring CMC Properties
- Configuring iDRAC Launch Method Using CMC Web Interface
- Configuring iDRAC Launch Method Using RACADM
- Configuring Login Lockout Policy Attributes Using CMC Web Interface
- Configuring Login Lockout Policy Attributes Using RACADM
- Understanding Redundant CMC Environment
- Configuring Front Panel
- Logging in to CMC
- Accessing CMC Web Interface
- Logging in to CMC as a Local User, Active Directory User, or LDAP User
- Logging in to CMC Using a Smart Card
- Logging in to CMC Using Single Sign-on
- Logging In To CMC Using Serial, Telnet, Or SSH Console
- Accessing CMC Using RACADM
- Logging in to CMC Using Public Key Authentication
- Multiple CMC Sessions
- Changing Default Login Password
- Enabling or Disabling Default Password Warning Message
- Use case scenarios
- Conversion of External Shared PERC 8 card High Availability to Non-High Availability Mode using Web Interface
- Conversion of External Shared PERC 8 card Non-High Availability to High Availability Mode using Web Interface
- Conversion of External Shared PERC 8 card High Availability to Non-High Availability Mode using RACADM
- Conversion of External Shared PERC 8 card Non-High Availability to High Availability Mode using RACADM
- Updating Firmware
- Downloading CMC Firmware
- Viewing Currently Installed Firmware Versions
- Updating the CMC Firmware
- Updating Chassis Infrastructure Firmware
- Updating Server iDRAC Firmware
- Updating Server Component Firmware
- Viewing Firmware Inventory
- Saving Chassis Inventory Report Using CMC Web Interface
- Configuring Network Share Using CMC Web Interface
- Lifecycle Controller Job Operations
- Rolling Back Server Component Firmware
- Upgrading Server Component Firmware
- Upgrading Server Component Firmware From File Using CMC Web Interface
- Server Component Single Click Update Using Network Share
- Pre-requisites for Using Network Share Update Mode
- Upgrading Server Component Firmware From Network Share Using CMC Web Interface
- Supported Firmware Versions for Server Component Update
- Deleting Scheduled Server Component Firmware Jobs
- Updating Storage Component Using CMC Web Interface
- Recovering iDRAC Firmware Using CMC
- Viewing Chassis Information and Monitoring Chassis and Component Health
- Viewing Chassis and Component Summaries
- Viewing Chassis Summary
- Viewing Chassis Controller Information and Status
- Viewing Information and Health Status of All Servers
- Viewing Health Status and Information for Individual Server
- Viewing Information and Health Status of the IOM
- Viewing Information and Health Status of Fans
- Viewing Front Panel Properties
- Viewing KVM Information and Health Status
- Viewing LCD Information and Health
- Viewing Information and Health Status of Temperature Sensors
- Viewing Storage Capacity and Status of the Storage Components
- Configuring CMC
- Viewing and Modifying CMC Network LAN Settings
- Viewing and Modifying CMC Network LAN Settings Using CMC Web Interface
- Viewing and Modifying CMC Network LAN Settings Using RACADM
- Enabling the CMC Network Interface
- Enabling or Disabling DHCP for the CMC Network Interface Address
- Enabling or Disabling DHCP for DNS IP Addresses
- Setting Static DNS IP addresses
- Configuring IPv4 and IPv6 DNS Settings
- Configuring Auto Negotiation, Duplex Mode, and Network Speed for IPv4 and IPv6
- Setting the Maximum Transmission Unit for IPv4 and IPv6
- Configuring CMC Network and Login Security Settings
- Configuring Virtual LAN Tag Properties for CMC
- Federal Information Processing Standards
- Configuring Services
- Configuring CMC Extended Storage Card
- Setting Up Chassis Group
- Adding Members To Chassis Group
- Removing a Member from the Leader
- Disbanding a Chassis Group
- Disabling an Individual Member at the Member Chassis
- Accessing the Web page of a Member Chassis or Server
- Propagating Leader Chassis Properties to Member Chassis
- Server Inventory for MCM group
- Saving Server Inventory Report
- Chassis Group Inventory and Firmware Version
- Viewing Chassis Group Inventory
- Viewing Selected Chassis Inventory Using Web Interface
- Viewing Selected Server Component Firmware Versions Using Web Interface
- Chassis Configuration Profiles
- Configuring Multiple CMCs Using RACADM
- Configuring Multiple CMCs through RACADM Using Chassis Configuration Profiles
- Viewing and Ending CMC Sessions
- Viewing and Modifying CMC Network LAN Settings
- Configuring Servers
- Configuring Slot Names
- Configuring iDRAC Network Settings
- Configuring iDRAC Virtual LAN Tag Settings
- Setting First Boot Device
- Configuring Server FlexAddress
- Configuring Remote File Share
- Configuring Profile Settings Using Server Configuration Replication
- Accessing Server Profiles Page
- Adding or Saving Profile
- Applying Profile
- Importing Profile
- Exporting Profile
- Editing Profile
- Deleting Profile
- Viewing Profile Settings
- Viewing Stored Profile Settings
- Viewing Profile Log
- Completion Status And Troubleshooting
- Quick Deploy of Profiles
- Assigning Server Profiles to Slots
- Boot Identity Profiles
- Saving Boot Identity Profiles
- Applying Boot Identity Profiles
- Clearing Boot Identity Profiles
- Viewing Stored Boot Identity Profiles
- Importing Boot Identity Profiles
- Exporting Boot Identity Profiles
- Deleting Boot Identity Profiles
- Managing Virtual MAC Address Pool
- Creating MAC Pool
- Adding MAC Addresses
- Removing MAC Addresses
- Deactivating MAC Addresses
- Launching iDRAC using Single Sign-On
- Launching Remote Console
- Configuring CMC To Send Alerts
- Configuring User Accounts and Privileges
- Types of Users
- Modifying Root User Administrator Account Settings
- Configuring Local Users
- Configuring Active Directory Users
- Supported Active Directory Authentication Mechanisms
- Standard Schema Active Directory Overview
- Configuring Standard Schema Active Directory
- Extended Schema Active Directory Overview
- Configuring Extended Schema Active Directory
- Configuring Generic LDAP Users
- Configuring CMC For Single Sign-On Or Smart Card Login
- Configuring CMC to Use Command Line Consoles
- Using FlexAddress and FlexAdress Plus
- About FlexAddress
- Configuring FlexAddress
- Viewing World Wide Name or Media Access Control Addresses
- Viewing WWN or MAC Address Information
- Viewing Basic WWN or MAC Address Information Using Web Interface
- Viewing Advanced WWN or MAC Address Information Using Web Interface
- Viewing WWN or MAC Address Information Using RACADM
- Command Messages
- FlexAddress DELL SOFTWARE LICENSE AGREEMENT
- Managing Fabrics
- Managing and Monitoring Power
- Redundancy Policies
- Dynamic Power Supply Engagement
- Default Redundancy Configuration
- Power Budgeting For Hardware Modules
- Server Slot Power Priority Settings
- Assigning Priority Levels To Servers
- Assigning Priority Levels To Servers Using CMC Web Interface
- Assigning Priority Levels To Servers Using RACADM
- Viewing Power Consumption Status
- Viewing Power Budget Status Using CMC Web Interface
- Redundancy Status and Overall Power Health
- Configuring power budget and redundancy
- Executing Power Control Operations
- Executing Power Control Operations on a Server
- Executing Power Control Operations for Multiple Servers Using CMC Web Interface
- Executing Power Control Operations on the IOM
- Managing Chassis Storage
- Viewing Status of the Storage Components
- Viewing the Storage Topology
- Viewing Fault-tolerant Troubleshooting Information of SPERC Using CMC Web Interface
- Assigning Virtual Adapters To Slots Using CMC Web Interface
- Fault-Tolerance in Storage Controllers
- Security Key Mismatch
- Viewing Controller Properties Using CMC Web Interface
- Viewing Controller Properties Using RACADM
- Configuring Storage Controller Settings
- Shared PERC Controllers
- Enabling or Disabling RAID Controller Using CMC Web Interface
- Enabling or Disabling RAID Controller Using RACADM
- Enabling or disabling fault tolerance of external RAID controller using RACADM
- Viewing Physical Disk Properties Using the CMC Web Interface
- Viewing Physical Disk Drives Properties Using RACADM
- Identifying Physical Disks and Virtual Disks
- Assigning Global Hot Spares Using CMC Web Interface
- Assigning Global Hot Spares Using RACADM
- Recovering Physical Disks
- Viewing Virtual Disk Properties Using CMC Web Interface
- Viewing Virtual Disk Properties Using RACADM
- Creating Virtual Disk Using CMC Web Interface
- Managing Encryption Keys
- Encrypting Virtual Disks
- Unlocking Foreign Configuration
- Cryptographic Erase
- Applying Virtual Adapter Access Policy To Virtual Disks
- Modifying Virtual Disk Properties Using CMC Web Interface
- Enclosure Management Module
- Viewing EMM Status and attributes
- Viewing Enclosure Status and Attributes
- Reporting up to two Enclosures per Connector
- Setting Asset Tag and Asset Name of the Enclosure
- Viewing Temperature Probe Status and attributes of the Enclosure
- Setting the Temperature Warning Threshold of the Enclosure
- Viewing Fan Status and attributes of the Enclosure
- Viewing Enclosure Properties Using CMC Web Interface
- Managing PCIe Slots
- Troubleshooting and Recovery
- Resetting Forgotten Administrative Password
- Gathering Configuration Information, Chassis Status, and Logs Using RACDUMP
- First Steps to Troubleshoot a Remote System
- Troubleshooting Alerts
- Viewing Event Logs
- Using Diagnostic Console
- Resetting Components
- Saving or Restoring Chassis Configuration
- Troubleshooting Network Time Protocol Errors
- Interpreting LED Colors and Blinking Patterns
- Troubleshooting Non-responsive CMC
- Troubleshooting Network Problems
- Troubleshooting Controller
- Hotplugging enclosures in fault-tolerant chassis
- Using LCD Panel Interface
- Frequently Asked Questions

To view the chassis health, click Chassis Overview. The system displays the overall health status of the chassis, active and
standby CMCs, server modules, IO Module (IOM), fans, blowers, power supply units (PSUs), LCD assembly, storage controller,
and PCIe devices. Detailed information about each component is displayed when you click that component. In addition, the latest
events in the CMC Hardware Log are also displayed. For more information, see the Online Help.
If your chassis is configured as a Group Lead, the Group Health page is displayed after login. It displays the chassis level
information and alerts. All active, critical, and non-critical alerts are displayed.
Chassis Graphics
The chassis is represented by the front and back views (the upper and lower images respectively). Servers, DVDs, HDDs,
KVMs, and LCD are shown in the front view and the remaining components are shown in the back view. Component selection
is indicated by a blue cast and is controlled by clicking the image of the required component. When a component is present
in the chassis, an icon of the component type is displayed in the graphics in the position (slot), where the component has
been installed. Empty positions are shown with a charcoal gray background. The component icon visually indicates the state
of the component. Other components display icons that visually represent the physical component. Pausing the cursor over a
component displays a tool tip with additional information about that component.
Table 14. Server Icon States
Icon Description
A server is present, turned on, and is operating normally.
A server is present, but turned off.
A server is present, but reporting a noncritical error.
Viewing Chassis Information and Monitoring Chassis and Component Health 65