
Reference Guide
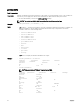

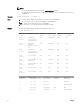
Table Of Contents
- Chassis Management Controller Version 2.2 for Dell PowerEdge VRTX RACADM Command Line Reference Guide
- Introduction
- RACADM Subcommand Details
- Guidelines to Quote Strings Containing Special Characters When Using RACADM Commands
- "?"and "?
" - help and help
- chassislog
- chassislog export
- chassislog clear
- chassisaction
- closessn
- clrsel
- cmcchangeover
- config
- connect
- deploy
- Displayable Characters
- eventfilters
- fanoffset
- feature
- featurecard
- fwupdate
- get
- getactiveerrors
- getassettag
- getchassisname
- getconfig
- getdcinfo
- getflexaddr
- getioinfo
- getled
- getmacaddress
- getmodinfo
- getniccfg
- getpbinfo
- getpciecfg
- getpminfo
- getraclog
- getractime
- getredundancymode
- getsel
- getsensorinfo
- getslotname
- getssninfo
- getsvctag
- getsysinfo
- gettracelog
- getversion
- ifconfig
- jobqueue
- krbkeytabupload
- license
- netstat
- ping
- ping6
- racdump
- racreset
- racresetcfg
- racresetpcie
- raid
- remoteimage
- serveraction
- set
- setassettag
- setchassisname
- set controllers
- setflexaddr
- setled
- set enclosure
- setniccfg
- setpciecfg
- setractime
- setslotname
- setsysinfo
- SSH or Telnet RACADM
- sshpkauth
- sslcertupload
- sslcertview
- sslcsrgen
- sslresetcfg
- set tempprobes
- testemail
- testfeature
- testtrap
- traceroute
- traceroute6
- CMC Property Database Group and Object Descriptions
- idRacInfo
- cfgLanNetworking
- cfgNicIPv4Enable (Read or Write)
- cfgNicVLanId (Read or Write)
- cfgDNSDomainNameFromDHCP (Read/Write)
- cfgDNSDomainName (Read/Write)
- cfgDNSRacName (Read/Write)
- cfgDNSRegisterRac (Read/Write)
- cfgDNSServersFromDHCP (Read/Write)
- cfgDNSServer1 (Read/Write)
- cfgDNSServer2 (Read/Write)
- cfgNicEnable (Read/Write)
- cfgNicIpAddress (Read/Write)
- cfgNicNetmask (Read/Write)
- cfgNicGateway (Read/Write)
- cfgNicMacAddress (Read Only)
- cfgRemoteHosts
- cfgRhostsFwUpdateTftpEnable (Read/Write)
- cfgRhostsFwUpdateIpAddr (Read/Write)
- cfgRhostsFwUpdatePath (Read/Write)
- cfgRhostsSmtpServerIpAddr (Read/Write)
- cfgRhostsNtpEnable
- cfgRhostsNtpServer1
- cfgRhostsNtpServer2
- cfgRhostsNtpServer3
- cfgRhostsNtpMaxDist
- cfgRhostsSyslogEnable (Read/Write)
- cfgRhostsSyslogPort (Read/Write)
- cfgRhostsSyslogServer1 (Read/Write)
- cfgRhostsSyslogServer2 (Read/Write)
- cfgRhostsSyslogServer3 (Read/Write)
- cfgRhostsSyslogPowerLoggingEnabled
- cfgRhostsSyslogPowerLoggingInterval
- cfgUserAdmin
- cfgEmailAlert
- cfgSessionManagement
- cfgSerial
- cfgOobSnmp
- cfgTraps
- cfgRacTuning
- cfgRacTuneDefCredentialWarningEnable
- cfgRacTuneRemoteRacadmEnable (Read/Write)
- cfgRacTuneHttpPort (Read/Write)
- cfgRacTuneHttpsPort (Read/Write)
- cfgRacTuneIpRangeEnable (Read/Write)
- cfgRacTuneIpRangeAddr (Read/Write)
- cfgRacTuneIpRangeMask (Read/Write)
- cfgRacTuneIpBlkEnable (Read/Write)
- cfgRacTuneIpBlkFailCount (Read/Write)
- cfgRacTuneIpBlkFailWindow (Read/Write)
- cfgRacTuneIpBlkPenaltyTime (Read/Write)
- cfgRacTuneSshPort (Read/Write)
- cfgRacTuneTelnetPort (Read/Write)
- cfgRacTuneDaylightOffset (Read Only)
- cfgRacTuneTimezoneOffset (Read Only)
- cfgRacTuneWebserverEnable (Read/Write)
- cfgRacTuneFipsModeEnable
- cfgRacTuneTLSProtocolVersionEnable
- cfgServerInfo
- cfgServerInfoIndex (Read Only)
- cfgServerSlotNumber (Read Only)
- cfgServerServiceTag (Read Only)
- cfgServerName (Read/Write)
- cfgServerFW (Read Only)
- cfgServerBIOS (Read Only)
- cfgServerBmcMacAddress (Read Only)
- cfgServerNic1MacAddress (Read Only)
- cfgServerNic2MacAddress (Read Only)
- cfgServerNic3MacAddress (Read Only)
- cfgServerNic4MacAddress (Read Only)
- cfgServerPriority (Read/Write)
- cfgServerNicEnable (Read/Write)
- cfgServerIPMIOverLanEnable (Read/Write)
- cfgServerPowerBudgetAllocation (Read Only)
- cfgServerDNSRegisterIMC (Read/Write)
- cfgServerDNSIMCName (Read/Write)
- cfgServerRootPassword (Write Only)
- cfgServerFirstBootDevice (Read/Write)
- cfgServerBootOnce (Read/Write)
- cfgServerPowerConsumption (Read Only)
- cfgActiveDirectory
- cfgADRacName (Read/Write)
- cfgADCertValidationEnable (Read/Write)
- cfgADRacDomain (Read/Write)
- cfgADRootDomain (Read/Write)
- cfgADEnable (Read/Write)
- cfgADAuthTimeout (Read/Write)
- cfgADSCLEnable
- cfgADSSOEnable (Read/Write)
- cfgADDomainController1 (Read/Write)
- cfgADDomainController2 (Read/Write)
- cfgADDomainController3 (Read/Write)
- cfgADGlobalCatalog1 (Read/Write)
- cfgADGlobalCatalog2 (Read/Write)
- cfgADGlobalCatalog3 (Read/Write)
- cfgADType (Read/Write)
- cfgADDcSRVLookupbyUserdomain (Read/Write)
- cfgADDcSRVLookupDomainName (Read/Write)
- cfgADDcSRVLookupEnable (Read/Write)
- cfgADGcRootDomain (Read/Write)
- cfgADGcSRVLookupEnable (Read/Write)
- cfgADSpecifyServerEnable
- cfgLDAP
- cfgLDAPEnable (Read/Write)
- cfgLDAPServer (Read/Write)
- cfgLDAPPort (Read/Write)
- cfgLDAPBasedn (Read/Write)
- cfgLDAPUserAttribute (Read/Write)
- cfgLDAPGroupAttribute (Read/Write)
- cfgLDAPGroupAttributeIsDN (Read/Write)
- cfgLDAPBinddn (Read/Write)
- cfgLDAPBindpassword (Write Only)
- cfgLDAPSearchFilter (Read/Write)
- cfgLDAPCertValidationEnable (Read/Write)
- cfgLDAPNetworkTimeout
- cfgLDAPSearchTimeout
- cfgLDAPSRVLookupDomainName
- cfgLDAPSRVLookupEnable
- cfgLDAPSRVLookupServiceName (Read/Write)
- cfgLDAPRoleGroup
- cfgLocation
- cfgStandardSchema
- cfgChassisPower
- cfgChassisInPower (Read Only)
- cfgChassisPeakPower (Read Only)
- cfgChassisPeakPowerTimestamp (Read Only)
- cfgChassisMinPower (Read Only)
- cfgChassisMinPowerTimestamp (Read Only)
- cfgChassisPowerStatus (Read Only)
- cfgChassisRedundantState (Read Only)
- cfgChassisDefaultPowerCapUpperBound (Read Only)
- cfgChassisDefaultPowerCapUpperBoundBTU(Read Only)
- cfgChassisDefaultPowerCapLowerBound (Read Only)
- cfgChassisDefaultPowerCapLowerBoundBTU(Read Only)
- cfgChassisPowerCap (Read/Write)
- cfgChassisPowerCapF (Read/Write)
- cfgChassisPowerCapFBTU (Read/Write)
- cfgChassisPowerCapPercent (Read or Write)
- cfgChassisPowerCapFPercent (Read/Write)
- cfgChassisRedundancyPolicy (Read/Write)
- cfgChassisDynamicPSUEngagementEnable (Read/Write)
- cfgChassisInMaxPowerCapacity (Read Only)
- cfgChassisInRedundancyReserve (Read Only)
- cfgChassisInPowerServerAllocation (Read Only)
- cfgChassisInfrastructureInPowerAllocation (Read Only)
- cfgChassisTotalInPowerAvailable (Read Only)
- cfgChassisStandbyInPowerCapacity (Read Only)
- cfgChassisPowerClear (Write Only)
- cfgChassisPowerClearTimestamp (Read Only)
- cfgChassisPowerButtonEnable (Read/Write)
- cfgSystemEnergyConsumptionClear (Write Only)
- cfgChassisServerBasedPowerMgmtMode
- cfgChassisPowerCapBTU (Read/Write)
- cfgChassisACPowerRecoveryDisable
- cfgKVMInfo
- cfgDvdInfo
- cfgLcdInfo
- cfgAlerting
- cfgIPv6LanNetworking
- cfgCurrentLanNetworking (Read Only)
- cfgCurrentIPv6LanNetworking (Read Only)
- cfgNetTuning
- cfgRacSecurity
- cfgQuickDeploy
- cfgActionOnServerInsertion
- cfgSetiDRACRootPasswordOnServerInsertion
- cfgiDRACRootPassword
- cfgEnableiDRACLAN
- cfgEnableiDRACIPv4
- cfgEnableiDRACIPMIOverLAN
- cfgEnableiDRACIPv4DHCP
- cfgStartingiDRACIPv4Address
- cfgiDRACIPv4GateWay
- cfgiDRACIPv4Netmask
- cfgEnableiDRACIPv6
- cfgEnableiDRACIPv6AutoConfig
- cfgiDRACIPv6PrefixLength
- cfgiDRACIPv6Gateway
- cfgReservedIPAddressNumbers
- cfgUseCMCDNSSettings

[Real-Time Energy Statistics]
System Energy Consumption =
6.4 kWh
System Energy Consumption Start Time =
16:02:10 01/16/2008
System Energy Consumption Timestamp =
16:02:10 01/16/2008
[System Power Status]
Chassis Power State = ON
Overall Power Health = OK
Redundancy = No
[System Power Policy Configuration]
System Input Power Cap =
7928 W (7928 BTU/hr |
10%)
Surplus for Peak Performance =
7000 W (6130 BTU/hr)
Redundancy Policy = None
Dynamic PSU Engagement Enabled = No
[Power Budgeting]
System Input Max Power
Capacity = 0 W
Input Redundancy
Reserve = 0 W
Input Power Allocated to
Servers = 0 W
Input Power Allocated to Chassis
Infrastructure = 51W
Total Input Power Available for Allocation =
0 W
Standby Input Power
Capacity = 0 W
getraclog
Description
The getraclog command displays RAC log entries.
Synopsis
racadm getraclog [-s <start>] [-c <count>]
Input
NOTE: If no options are provided, the entire log is displayed.
• -c — Specifies the number of records to display.
• -s — Specifies the starting record used for the display.
• --more — Displays one screen at a time and prompts the user to continue.
Output
The default output display shows the record number, message ID, category, agent ID, severity, time stamp,
message arg, and message. The timestamp begins at midnight, January 1, and increases until the system
restarts. After the system restarts, the system’s timestamp is used.
SeqNumber = 4
Message ID = CMC8550
Category = Audit
AgentID = CMC
Severity = Information
Timestamp = 1982-03-21 05:33:35
Message Arg 1 = Healthy
Message = Chassis health is Healthy
Example
• Displays all the logs.
racadm getraclog
50