
Users Guide
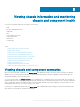

Chassis graphics
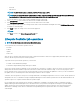
The chassis is represented by the front, back, and the top views—the upper and lower images respectively. Servers, and KVMs are shown
in the front view and the remaining components are shown in the back view. A blue cast indicates the component selection and is
controlled by clicking the image of the required component. When a component is present in the chassis, an icon of the component type is
displayed in the graphics in the position (slot), where the component has been installed. Empty positions are shown with a charcoal gray
background. The component icon visually indicates the state of the component. Other components display icons that visually represent the
physical component. Pausing the cursor over a component displays a tool tip with additional information about that component.
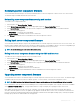
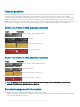
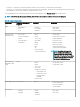
Server Icon States in 13th generation systems
Image Description
A server is present, turned on, and is operating normally.
A server is present, but turned o.
A server is present, but reporting a noncritical error.
A server is present, but reporting a critical error.
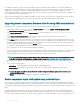
Server Icon States in 14th generation systems
Image
Description
A server is present, turned on, and is operating normally.
A server is present, but turned o.
A server is present, but reporting a noncritical error.
A server is present, but reporting a critical error.
NOTE: By default, the server state icons for Dell's 13th generation PowerEdge systems are displayed if, you insert a 14th
generation PowerEdge server when the chassis is turned o.
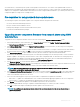
Selected component information
Information for the selected component is displayed in three independent sections:
• Health and Performance, and Properties — Displays the active, critical, and non-critical events as displayed by the hardware logs and
the performance data that vary with time.
58
Viewing chassis information and monitoring chassis and component health