
User's Manual


108 Using the CMC Web Interface
To view health status for individual servers using Chassis Graphics:
1
Log in to the CMC Web interface.
2
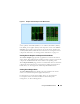
The
Chassis Status
page is displayed. The center section of
Chassis
Graphics
depicts the front view of the chassis and contains the health
status for individual servers. Server health status is indicated by the color
of the server subgraphic:
• Green - server is present, powered on and communicating with the
CMC; there is no indication of an adverse condition.
• Amber - server is present, but may or may not be powered on, or may
or may not be communicating with the CMC; an adverse condition
may exist.
• Gray - server is present and not powered on. It is not communicating
with the CMC and there is no indication of an adverse condition.
3
Use the cursor to hover over an individual server subgraphic and a
corresponding text hint or screen tip is displayed. The text hint provides
additional information on that server.
4
The server subgraphic is hyperlinked to the corresponding CMC GUI page
to provide immediate navigation to the
Server Status
page for that server.
The Server Status page (separate from the Servers Status page) provides an
overview of the server and a launch point to the Web interface for the
Integrated Dell Remote Access Controller (iDRAC), which is the firmware
used to manage the server.
NOTE: To use the iDRAC user interface, you must have an iDRAC user name and
password. For more information about iDRAC and the using the iDRAC Web
interface, see the Integrated Dell Remote Access Controller Firmware User’s Guide.
To view the health status of an individual server:
1
Log in to the CMC Web interface.
2
Expand
Servers
in the system tree. All of the servers (1–16) appear in the
expanded
Servers
list.
3
Click the server (slot) you want to view. The
Server Status
page displays.
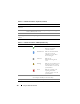
Table 5-3 through Table 5-8 provide descriptions of the information on the
Server Status page.