
User's Manual


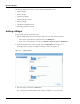

Table Of Contents
- Contents
- About This Guide
- Chapter 1
- Active System Manager Overview
- Chapter 2
- Getting Started
- Chapter 3
- Account Management
- Chapter 4
- User Profile Management
- Managing Security Functions
- Managing Groups
- Defining Permissions
- Modifying Permissions
- Managing Authentication Repositories
- Chapter 5
- Inventory Management
- Understanding Resource Modeling
- Building a Standard Active System Manager Inventory
- Configuring Discovery Setup
- Running Discovery
- Using Resource Types
- Using Resource Instances
- Building Resource Instances
- Modifying Core Properties for Resource Instances
- Modifying Resource Instance Resource Availability Dates
- Modifying Resource Instance Interfaces
- Displaying the Resource Availability Calendar View
- Deleting Resource Instances
- Setting Inventory Parameter Values
- Resolving Resource Dependencies
- Using Resource Interface Types
- Linking Resources
- Importing Inventory
- Importing Connectivity
- Exporting Connectivity
- Managing Resource Pools
- Managing Maintenance Windows
- Managing Virtual Resources
- Chapter 6
- Firmware Management
- Creating Active System Manager Software Repositories
- Updating Dell Chassis Firmware from the Operations Center
- Updating Dell Server Firmware
- Updating Dell Blade/Rack Servers Firmware from the Operation Center
- Updating Dell Blade/Rack Servers Firmware from an Active Session
- Updating Dell Blade/Rack Servers Firmware Using the Attach Server Profile Virtual Operation
- Updating Dell Blade/Rack Servers Firmware through an Orchestration
- Updating Dell Blade/Rack Servers Firmware Using the Attach Server Profile Custom Operation
- Minimum Firmware Versions for Active System Manager Components
- Chapter 7
- Server Template and Profiles
- Creating a Server Template
- Editing a Server Template
- Adding or Editing BIOS Information on a Server Template
- Adding or Editing RAID Information on a Server Template
- Adding or Editing Firmware Settings on a Server Template
- Adding or Editing Networks Settings on a Server Template
- Naming Conventions when using Orchestrations
- Server Profiles
- Chapter 8
- Using Inventory
- Chapter 9
- Repository Management
- Chapter 10
- Network Management
- Chapter 11
- Template Management
- Template Types
- Working with Templates
- Creating New Templates
- Saving Templates
- Changing Template Ownership and Permissions
- Opening Templates
- Closing Templates
- Deleting Templates
- Managing Template History Details
- Filtering Templates
- Validating Templates
- Importing Templates
- Exporting Templates
- Attaching a Template Image
- Scheduling Templates
- Archiving Templates using the Templates View
- Restoring Archived Templates
- Updating Templates using the Template Editor
- Viewing and Modifying Template Properties
- Adding Resource Types
- Setting Resource Type Properties for Scheduling
- Deleting Resource Types
- Adding Resource Types Based on Manufacturer Only
- Adding Resource Instances
- Modifying Resource Properties
- Deleting Resource Instances
- Defining Provisioning Policies
- Supporting Layer 2 Switching
- Using Annotations
- Updating Templates using the Link Editor
- Associating an Orchestration Workflow with Templates
- Chapter 12
- Session Management
- Introducing the Sessions Perspective
- Working with Running Sessions
- Scheduling a Session Using Templates
- Creating an Instant Session
- Opening Sessions
- Opening the Session Editor
- Using the Sessions Calendar
- Viewing Session Properties
- Editing Default Session Properties
- Assigning and Changing Session Ownership
- Canceling Sessions
- Deleting Sessions
- Purging Sessions
- Rescheduling Sessions
- Managing Session Links
- Handling Link Preemption
- Managing Session Resources
- Associating Scripts to Sessions
- Archiving Sessions
- Supporting Layer 2 Switching
- Saving Sessions
- Configuring Session Notifications and Reminders
- Starting and Stopping ASAP Rescheduling
- Managing Virtual Resources
- Chapter 13
- Orchestration Management
- Chapter 14
- Working with Test and Script Execution
- Chapter 15
- Reports
- Chapter 16
- Settings
- Chapter 17
- Dashboard

Managing Widgets
17-2 Active System Manager User Guide, Release 7.1
Managing Widgets
The Dashboard perspective contains widgets that define your infrastructure in a specific layout. A widget
is a stand-alone application that can be embedded into third party sites by any user on a page where they
have rights of authorship (e.g. a web page, blog, or profile on a social media site). Widgets allow users to
turn personal content into dynamic web apps that can be shared on websites where the code can be installed.
The Active System Manager comes with a default set of widgets (11) already defined:
Table 17-1 Default Set of Widgets
Widget Description
Resource Allocation By
Session
Provides resource allocation data for sessions in a Running state. This
report displays CPU and memory allocations grouped by sessions.
Resource Allocation by
Host
Provides resource allocation data for hosts on which some virtual
machine instances are provisioned in the current running sessions. This
report displays CPU and memory allocations grouped by hosts.
Resource Allocation By
Group
Displays resource allocation data for virtual resources that are utilized
in sessions owned by members of a group, grouped by an Active
System Manager group name. This report also captures current group
allocation, including CPU and memory allocation.
To configure: schedule a session with virtual machines (VMs) and the
session owner should be part of one the groups. When the session is in
a running state, the graph displays a grouped allocation of resources.
Top ten Resource
Allocation
Displays the top 10 users who currently consume a maximum of CPU
and memory resources.
Top ten Resource
Utilization
Displays the top 10 hypervisor cluster resource utilization in the data
center.
VM Utilization by Session Displays the most recent data (in percentage) for CPU and memory
utilized on any VM, grouped by sessions.
To configure: schedule a session with a VM and use the monitor
operation to capture utilization data is present in RA. When the session
is in a running state, it displays utilization in that specific session.
Host Utilization
(Consolidated)
Displays information about how much capacity is utilized on a host by
all running VMs with respect to the allocated capacity.
To configure: Open the Operations perspective, select a discovered
host, and right-click to execute monitoring on that host.
Cluster Utilization
(Consolidated)
Provides information about how much CPU and memory resources are
utilized on a cluster by all running virtual machines, with respect to the
allocated capacity.
Storage Utilization
(Consolidated)
Provides storage utilization as a percentage of allocated storage for
hypervisor clusters.
CPU/Memory Utilization
Over Time Graph for
Hosts
Displays CPU and memory utilization of hosts in percentage over a give
period of time (eg. Weekly, 3Days,Daily, Hourly).
To configure: start monitoring on the host; utilization data will be pushed
to the database, which will be retrieved, depending on time intervals.