
User's Manual
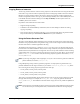
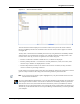


Table Of Contents
- Contents
- About This Guide
- Chapter 1
- Active System Manager Overview
- Chapter 2
- Getting Started
- Chapter 3
- Account Management
- Chapter 4
- User Profile Management
- Managing Security Functions
- Managing Groups
- Defining Permissions
- Modifying Permissions
- Managing Authentication Repositories
- Chapter 5
- Inventory Management
- Understanding Resource Modeling
- Building a Standard Active System Manager Inventory
- Configuring Discovery Setup
- Running Discovery
- Using Resource Types
- Using Resource Instances
- Building Resource Instances
- Modifying Core Properties for Resource Instances
- Modifying Resource Instance Resource Availability Dates
- Modifying Resource Instance Interfaces
- Displaying the Resource Availability Calendar View
- Deleting Resource Instances
- Setting Inventory Parameter Values
- Resolving Resource Dependencies
- Using Resource Interface Types
- Linking Resources
- Importing Inventory
- Importing Connectivity
- Exporting Connectivity
- Managing Resource Pools
- Managing Maintenance Windows
- Managing Virtual Resources
- Chapter 6
- Firmware Management
- Creating Active System Manager Software Repositories
- Updating Dell Chassis Firmware from the Operations Center
- Updating Dell Server Firmware
- Updating Dell Blade/Rack Servers Firmware from the Operation Center
- Updating Dell Blade/Rack Servers Firmware from an Active Session
- Updating Dell Blade/Rack Servers Firmware Using the Attach Server Profile Virtual Operation
- Updating Dell Blade/Rack Servers Firmware through an Orchestration
- Updating Dell Blade/Rack Servers Firmware Using the Attach Server Profile Custom Operation
- Minimum Firmware Versions for Active System Manager Components
- Chapter 7
- Server Template and Profiles
- Creating a Server Template
- Editing a Server Template
- Adding or Editing BIOS Information on a Server Template
- Adding or Editing RAID Information on a Server Template
- Adding or Editing Firmware Settings on a Server Template
- Adding or Editing Networks Settings on a Server Template
- Naming Conventions when using Orchestrations
- Server Profiles
- Chapter 8
- Using Inventory
- Chapter 9
- Repository Management
- Chapter 10
- Network Management
- Chapter 11
- Template Management
- Template Types
- Working with Templates
- Creating New Templates
- Saving Templates
- Changing Template Ownership and Permissions
- Opening Templates
- Closing Templates
- Deleting Templates
- Managing Template History Details
- Filtering Templates
- Validating Templates
- Importing Templates
- Exporting Templates
- Attaching a Template Image
- Scheduling Templates
- Archiving Templates using the Templates View
- Restoring Archived Templates
- Updating Templates using the Template Editor
- Viewing and Modifying Template Properties
- Adding Resource Types
- Setting Resource Type Properties for Scheduling
- Deleting Resource Types
- Adding Resource Types Based on Manufacturer Only
- Adding Resource Instances
- Modifying Resource Properties
- Deleting Resource Instances
- Defining Provisioning Policies
- Supporting Layer 2 Switching
- Using Annotations
- Updating Templates using the Link Editor
- Associating an Orchestration Workflow with Templates
- Chapter 12
- Session Management
- Introducing the Sessions Perspective
- Working with Running Sessions
- Scheduling a Session Using Templates
- Creating an Instant Session
- Opening Sessions
- Opening the Session Editor
- Using the Sessions Calendar
- Viewing Session Properties
- Editing Default Session Properties
- Assigning and Changing Session Ownership
- Canceling Sessions
- Deleting Sessions
- Purging Sessions
- Rescheduling Sessions
- Managing Session Links
- Handling Link Preemption
- Managing Session Resources
- Associating Scripts to Sessions
- Archiving Sessions
- Supporting Layer 2 Switching
- Saving Sessions
- Configuring Session Notifications and Reminders
- Starting and Stopping ASAP Rescheduling
- Managing Virtual Resources
- Chapter 13
- Orchestration Management
- Chapter 14
- Working with Test and Script Execution
- Chapter 15
- Reports
- Chapter 16
- Settings
- Chapter 17
- Dashboard
Using Resource Instances
Inventory Management 5-29
Figure 5-17 Resource Allocation Statistics
All of the associated sessions display for each resource instance that is part of the session within the
Resource Availability calendar. The associated sessions for each resource instance appear as a colored
rectangular bar.
You may want to check status and availability for resources by using the Resource Availability calendar
with the Session view and the Resource Instances view. Allocation statistics are displayed next to the
resource name or asset tag. A resource is organized in one of three categories:
• Resource not allocated—Dubbed “available for use”; no statistics are displayed.
• Resource partially allocated—A resource that is currently allocated to, at least, one session, with a
subset of its port. Statistics are displayed from 1 to 99%.
• Resource fully allocated—Either in one session if one resource is not shared, or many sessions if
resource is shared. No percentage of statistics.
For all categories, the statistics reflect present time, when displayed. Statistics can change when a session
goes into a setup or teardown state. Setup ports become busy; teardown ports become free.
Note If you expand a session (within a yellow-highlighted row), only the associated resources for that
selected session are affected.
As a Active System Manager administrator, you can use the information in the calendar view to help users
make changes and resolve conflicts. You can also use the Resource Availability calendar to perform the
same functions as the users (check status and look for alternatives); however, the difference is that the
administrator can go to the specific Session view to change the session. Changes made in the Session view
calendar may not be reflected within the Active System Manager workbench until you refresh (press F5)
your workspace.