
Data Sheet
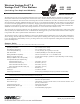
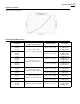
Table Of Contents

8
Wireless Vantage Pro2
™
Wind
Wind Chill (Calculated)
Resolution and Units. . . . . . . . . . . . . . . . . . . . . . . . . 1°F or 1°C (user-selectable) °C is converted from °F rounded to the nearest 1°C
Range. . . . . . . . . . . . . . . . . . . . . . . . . . . . . . . . . . . . -110° to +135°F (-79° to +57°C)
Accuracy . . . . . . . . . . . . . . . . . . . . . . . . . . . . . . . . . ±2°F (±1°C) (typical)
Update Interval . . . . . . . . . . . . . . . . . . . . . . . . . . . . . 10 to 12 seconds
Source . . . . . . . . . . . . . . . . . . . . . . . . . . . . . . . . . . . United States National Weather Service (NWS)/NOAA
Equation Used . . . . . . . . . . . . . . . . . . . . . . . . . . . . . Osczevski (1995) (adopted by US NWS in 2001)
Variables Used . . . . . . . . . . . . . . . . . . . . . . . . . . . . . Instant Outside Temperature and 10-min. Avg. Wind Speed
Current Display Data . . . . . . . . . . . . . . . . . . . . . . . . Instant Calculation
Current Graph Data . . . . . . . . . . . . . . . . . . . . . . . . . Instant Calculation; Hourly, Daily and Monthly Low
Historical Graph Data . . . . . . . . . . . . . . . . . . . . . . . . Hourly, Daily and Monthly Lows
Alarm . . . . . . . . . . . . . . . . . . . . . . . . . . . . . . . . . . . . Low Threshold from Instant Calculation
Wind Direction
Range. . . . . . . . . . . . . . . . . . . . . . . . . . . . . . . . . . . . 1 - 360°
Display Resolution . . . . . . . . . . . . . . . . . . . . . . . . . . 16 points (22.5°) on compass rose, 1° in numeric display
Accuracy . . . . . . . . . . . . . . . . . . . . . . . . . . . . . . . . . ±3°
Update Interval . . . . . . . . . . . . . . . . . . . . . . . . . . . . . 2.5 to 3 seconds
Current Display Data . . . . . . . . . . . . . . . . . . . . . . . . Instant (user-adjustable offset available)
Current Graph Data . . . . . . . . . . . . . . . . . . . . . . . . . Instant; 10-min. Dominant; Hourly, Daily, Monthly Dominant
Historical Graph Data . . . . . . . . . . . . . . . . . . . . . . . . Past 6 10-min. Dominants on compass rose only; Hourly, Daily, Monthly Dominants
Wind Speed
Resolution and Units. . . . . . . . . . . . . . . . . . . . . . . . . 1 mph, 1 km/h, 0.4 m/s, or 1 knot (user-selectable). Measured in mph, other units
are converted from mph and rounded to nearest 1 km/hr, 0.1 m/s, or 1 knot.
Range. . . . . . . . . . . . . . . . . . . . . . . . . . . . . . . . . . . . 0 to 200 mph, 0 to 173 knots, 0 to 89 m/s, 0 to 322 km/h
Update Interval . . . . . . . . . . . . . . . . . . . . . . . . . . . . . Instant Reading: 2.5 to 3 seconds, 10-minute Average: 1 minute
Accuracy . . . . . . . . . . . . . . . . . . . . . . . . . . . . . . . . . ±2 mph (2 kts, 3.2 km/h, 0.9 m/s) or ±5%, whichever is greater
Maximum Cable Length . . . . . . . . . . . . . . . . . . . . . . 240 feet (73 m) (See note on page 1)
Current Display Data . . . . . . . . . . . . . . . . . . . . . . . . Instant
Current Graph Data . . . . . . . . . . . . . . . . . . . . . . . . . Instant; 10-minute and Hourly Average; Hourly High; Daily, Monthly and Yearly
High with Direction of High
Historical Graph Data . . . . . . . . . . . . . . . . . . . . . . . . 10-min. and Hourly Averages; Hourly Highs; Daily, Monthly and Yearly Highs with
Direction of Highs
Alarms . . . . . . . . . . . . . . . . . . . . . . . . . . . . . . . . . . . High Thresholds from Instant Reading and 10-minute Average
Wireless Communications
Transmit/Receive Frequency Range and Power Output:
Transmitter ID codes: . . . . . . . . . . . . . . . . . . . . . . . 8 user-selectable
License: . . . . . . . . . . . . . . . . . . . . . . . . . . . . . . . . . . . . . Low power (less than 8 mW), no license required
Range: All models except Japan
Line of Sight . . . . . . . . . . . . . . . . . . . . . . . . . . . . . . . up to 1000 feet (300 m)
Through Walls . . . . . . . . . . . . . . . . . . . . . . . . . . . . . 200 to 400 feet (60 to 120 m)
Range: Japan models
Line of Sight . . . . . . . . . . . . . . . . . . . . . . . . . . . . . . . up to 300 feet (100 m)
Through Walls . . . . . . . . . . . . . . . . . . . . . . . . . . . . . 50 to 200 feet (15 to 60m)
Sensor Inputs
RF Filtering. . . . . . . . . . . . . . . . . . . . . . . . . . . . . . . . RC low-pass filter on each signal line
R
EGION FREQUENCY RANGE & POWER OUTPUT
USA 902 - 928 MHz FHSS, <8mW
EU 868.0 - 868.6 MHz FHSS, <8mW
Australia, Brazil 918 - 926 MHz FHSS, <8mW
New Zealand, Peru 921 - 928 MHz FHSS, <8mW
India 865 - 867 MHz FHSS, <8mW
Japan 928.15 - 929.65 MHz FHSS, <1mW
Taiwan 920 - 925 MHz FHSS, <8mW
Russia 868.7 - 869.2 MHz FHSS, <8mW