
User Manual


ST ANALYSIS
PatientNet Operator’s Manual, v1.04, 10001001-00X, Draft 169
All information contained herein is subject to the rights and restrictions on the title page.
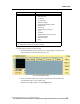
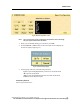
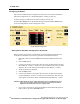
ST Segment End Point
Use the arrow buttons under ST End or move the orange slide bar to adjust the ST end
point between 5 and 300 ms past the J point in 5 ms increments. The default is J point
plus 80 ms. The ST end point must be greater than the ST start point.
System Defaults
To revert to system defaults for ST points and the isoelectric point, press Defaults on
the ST Configuration screen.
CAUTION: Verify that ST start and end points are accurate and reset them if necessary
before performing ST analysis on a patient.
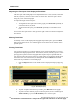
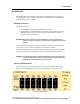
Measuring ST Elevation and Depression
The ST level is the difference between the waveform voltage at the isoelectric point
and the end point of the ST segment, and is expressed on the waveform in millimeters.
ST elevation is above the isoelectric point; ST depression, below.
You can measure the ST elevation/depression by means of a calibration pulse.
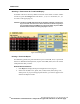
1. Press ST on the View screen to display the ST Analysis screen.
2. Press Cal Pulse repeatedly to scroll through the following. Your choice
appears on the templates.
• calibration pulse to the left of the ST segment
• no calibration pulse
• calibration pulse centered over the template
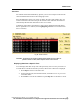
The size of the calibration pulse depends on the ECG wave size chosen in the Patient
Data Entry screen (see page 74) as follows:
ECG Size (mm/mv) Calibration Pulse Size (mv)
2.5, 5 or 10 1
20 0.5
40 0.25