
User`s guide

Gyro Control Unit (GCU)
User’s Guide
27
MaxMetrix, Scottsdale, AZ
PN: GCU-2K1-UG:RevI.2 NGC
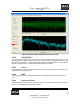
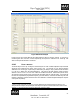
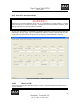
Figure 22 Bode Plot Analyzer
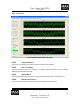
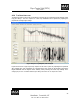
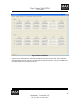
Figure 19 shows the several different gain setting and their effect on the Pitch channel. As the gain in
increased (green, blue, red, black, increase respectively) the response in extended out to ~250Hz @ -3db
where it intercepts the 266.667Hz notch filter.
4.1.4.1 HOW IT WORKS
4
The Bode analyzer works by exciting the selected torquer axis with constant amplitude swept sinusoidal
waveform while measuring the results at the pick-off coils. The amount of gyro wheel fluctuation
determines how well the gyro is performing as measured by its ability to stay in phase with the excitation
(i.e., the GCU’s ability track the input disturbance). The heart of the bode analyzer resides inside the
software of the GCU unit. The GCU unit creates the excitation waveforms, measures the pickoff values,
calculates the Fourier integral values, and stores the individual values to create the report. Once the Bode
function has completed the programmed frequency span and duration; it transfers the data using the USB
interface to the laptop computer where the values are combined to create the magnitude and phase response
of the system for plotting.
4
Note: The user must make sure the Gyro is firmly attached to the mounting surface or held in a vise
during the Bode Analyzer, the input torque of the swept sine input will cause small motions in the overall
structure (i.e., the outer housing will move) which will yield poor results.